
Technical outlook:
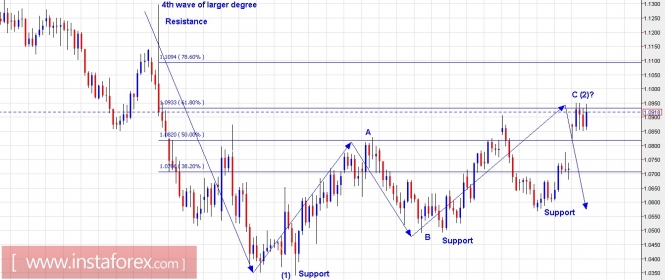
So the story continues as discussed earlier and EUR/USD probably just found a top around 1.0950 levels. Maybe at the most, one more high which looks less probable at the moment though. Please also note the evening star appeared yesterday and a good test was done today a few hours ago. Moreover, it has produced around the fibonacci 0.618 levels. A drop below 1.0860 from here would certainly prove with evidence that a major top is in place and that the pair has resumed its long-term downtrend. The wave structure indicates that we are into the last wave 5 of a larger degree, and within that wave we are most probably beginning into wave (3), with waves (1) and (2) looking to be complete as labelled above. Major resistance is at 1.13 levels while support on the Daily chart is at 1.0560 levels.
Trading plan:
Please remain short now with risk above 1.0950 levels targeting lower. The top looks to have formed but targets are long term.
GBPUSD chart setups:
Technical outlook:
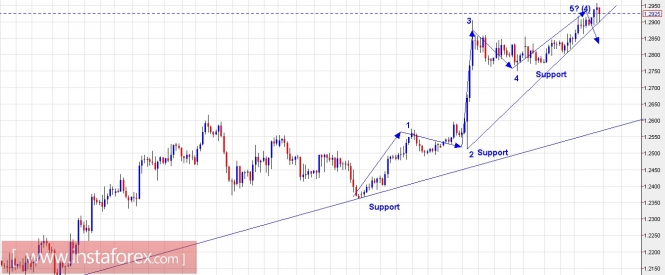
The GBP/USD pair is almost ready to drop from here according to our previous trading plans. The pair has formed interim highs at 1.2957 levels today and by most probability, it looks to have formed a top or is very close to forming one. Please watch out for a bearish reversal any moment now. The wave count also suggests that GBP/USD might have completed 5 waves and that the corrective rally since October 2016 maybe coming to an end now. A break below the immediate trend line would be the first confirmation that bears are getting into control and a subsequent break below 1.2750 levels would confirm that a major top is in place and that GBP/USD may resume its downtrend. Interim resistance is seen at 1.2957 levels now, while support is seen at 1.2750 levels respectively.
Trading plan:
One can initiate short levels now and around 1.2970 with a stop at 1.3 levels.
Fundamental outlook:
Most GDP figures were released today in the last few hours and the impact might have been already priced in by market participants. Therefore, tops and bottoms will be formed in the above pairs soon.
Good luck!
The material has been provided by InstaForex Company - www.instaforex.com