Gold price is trading around important Fibonacci support area of $1,265. Gold price is expected to at least make a bounce towards $1,275-80 where important short-term resistance is found. Gold could very well have finished the entire corrective decline.
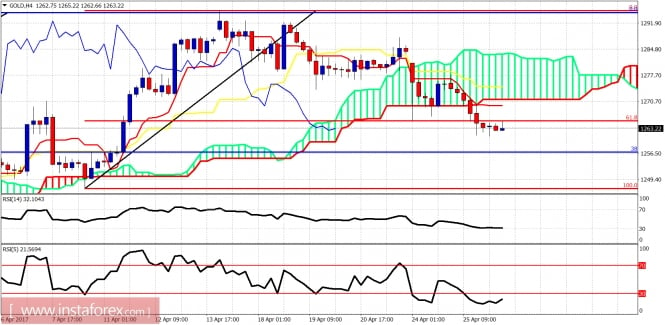
There are bearish divergence signs in the 4-hour chart that imply a back test at least of the cloud is expected. The cloud resistance is at $1,270. Breaking above it could push price towards $1,284 where the upper cloud boundary is found. Next major support for Gold is at $1,256.
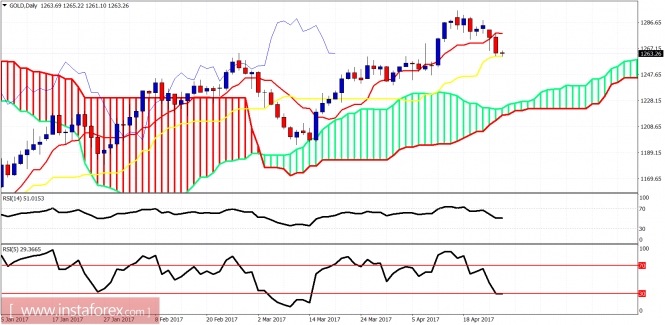
Gold price has reached the kijun-sen (yellow line indicator) support as expected after breaking below the tenkan-sen (red line indicator). A bounce from kijun-sen is justified. Resistance is now at the tenkan-sen at $1,278. So a daily close above the tenkan-sen will be a bullish sign. A daily close below the kijun-sen will most probably push prices towards the daily cloud support at $1,226.The material has been provided by InstaForex Company -
www.instaforex.com
