
Technical outlook:
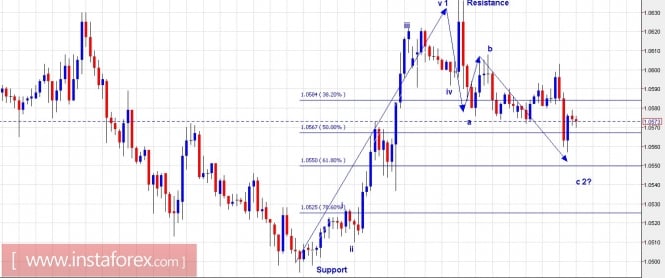
A short-term update has been presented here on the hourly chart setup for EUR/USD. The pair had unfolded into 5 waves from 1.0493 through 1.0640 level as depicted and labeled here as wave 1. Furthermore, the drop since then has been corrective in nature, labeled as a-b-c on the above chart (wave 2). The most probable wave count from here should unfold on the north side and push the prices towards 1.0650 and 1.0700 levels respectively. According to the larger wave picture, which is not shown here, 1.0700 level is also the Fibonacci 0.618 resistance of the entire drop from 1.0830 through 1.0492 level earlier. Please note that the larger trend is definitely down but an intermediary uptrend is a strong possibility from 1.0540/50 levels as depicted above. Immediate resistance is seen at 1.0640 level, while support is at 1.0493 level respectively.
Trading plan:
Aggressive traders might want to go long from 1.0540/50 levels, stop at 1.0490 and targets are 1.0650 and 1.0700. Conservative traders please remain flat for now and look to sell rallies through 1.0700 level.
USD/JPY chart setups:
Technical outlook:
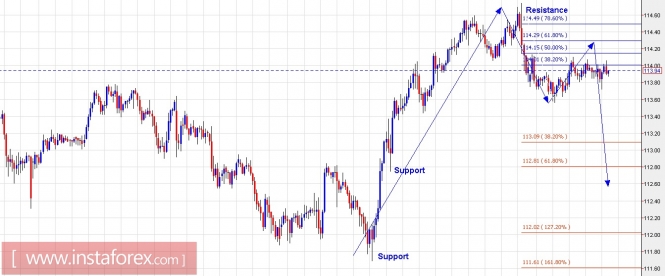
The USD/JPY pair might be preparing for a short-term setback towards lower levels, according to hourly chart presented here. The pair has reversed sharply from 114.75 level after hitting resistance consolidation trend line not shown here. The wave count suggests that USD/JPY should drop quickly towards 111.50/60 levels from here and complete the corrective drop which began from 118.50 level earlier. According to the short term/intraday chart setup here, the pair should attempt to hit 114.20/30 levels today during NY session and then reverse lower. Immediate resistance is seen at 114.75 level, while support is at 112.80 level respectively. Selling the pair during intraday rallies today is still a favored trading strategy. The pair could extend its drop to 112.00 and 111.60 levels at least, if not further.
Trading plan:
Please look to sell intraday rally towards 114.30 level, stop at 115.00 and target 112.00 plus.
Fundamental outlook:
With no heavy fundamental news today, please watch out for USD Trade Balance expected at -$48.0 billion to be out at 08:30 AM today. It should have medium to no major impact on the direction suggested above.
Good luck!
The material has been provided by InstaForex Company - www.instaforex.com