
The index is still in a battle to consolidate above the 200 SMA at H1 chart and such a move could deliver more bulls' force towards 102.39, where a breakout above that area should produce a rally to test the 103.40 level. Furthermore, if USDX manages to stay above the 103.00 level during the rest of the week, then we can target the psychological zone of 105.00. 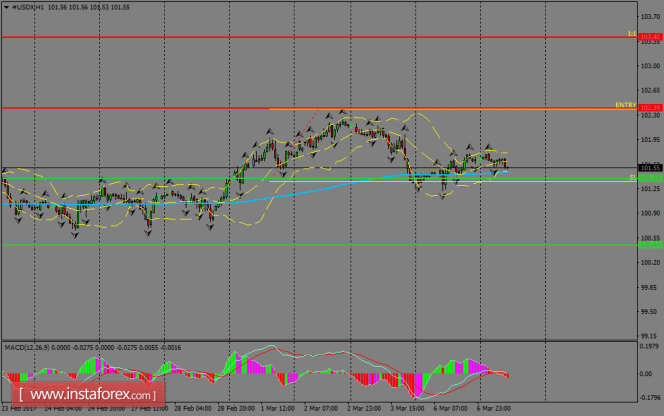
H1 chart's resistance levels: 102.39 / 103.40 H1 chart's support levels: 101.39 / 100.44 Trading recommendations for today: Based on the H1 chart, place buy (long) orders only if the USD Index breaks with a bullish candlestick; the resistance level is at 102.39, take profit is at 103.40, and stop loss is at 101.35.
The material has been provided by InstaForex Company - www.instaforex.com