
The Dollar index got rejected at 102.25 again yesterday and pulled back toward the short-term support at 101.70. Price is still trapped inside the trading range.The index is trading near its upper range boundary and so far it has been rejected each time it reached 102.30.
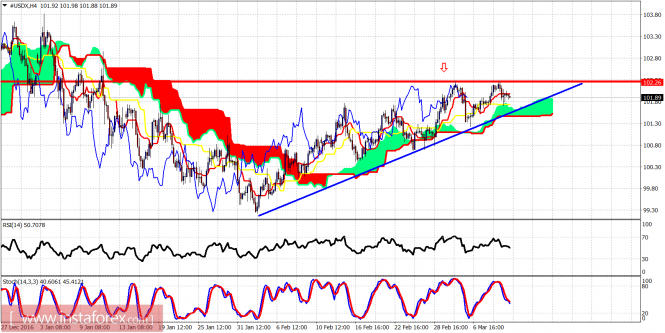
Blue line - trend line support
Red line - resistance
The Dollar index has most probably formed an ascending triangle pattern. Strong resistance is at 102.30 and a break above it will push the index toward 103. A break below 101.40 will open the way toward 100. Support is at 101.40. A double top was formed at 102.30. A break below 101.20 will push price at least toward 100.20.
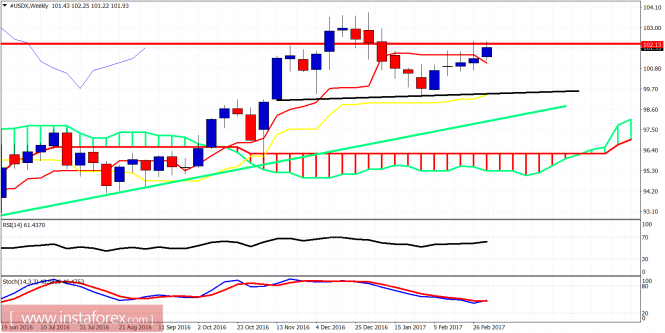
Red line - resistance
Black line- neckline support
Green line - long-term support trend line
The weekly chart remains bullish, but bulls will need to break above the red line resistance in order for the bulls to remain in control. Inability to break above 102.30 will result in a pull back and the creation of a lower high. This pattern will bring in a bearish scenario together with the Head and Shoulders pattern we discussed in a previous post. As long as price is above 101 bulls remain in control.
The material has been provided by InstaForex Company - www.instaforex.com