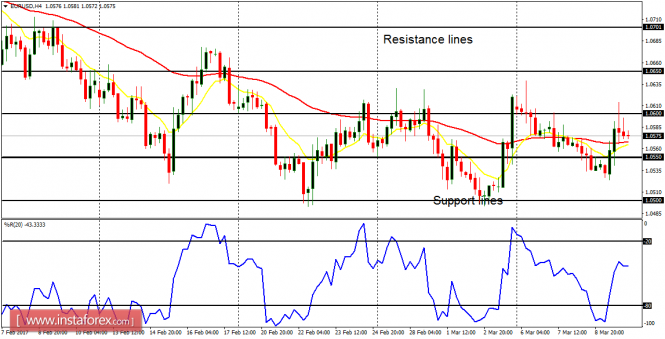
EUR/USD: The EUR/USD has consolidated so far this week. Price has oscillated between the support line at 1.0500 and the resistance line at 1.0650. Today or next week, it is expected that price would move above the aforementioned resistance line or below the support line, and then, a directional movement would begin. Otherwise, the bias on the market would turn neutral.
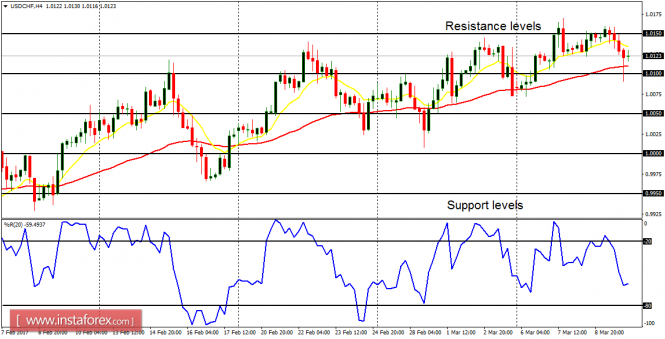
USD/CHF: The USD/CHF has been unable to stay above the resistance level at 1.0150 and the support level at 1.0050. Today or next week, it is expected that price would move above the aforementioned resistance level or below the support level, and then, a directional movement would begin. Otherwise, the bias on the market would turn neutral.
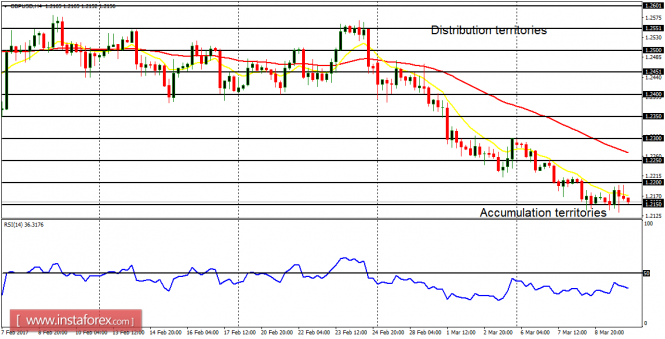
GBP/USD: This pair has gone south by 130 pips this week; having gone south by 300 pips since February 27, 2017. It looks like the accumulation territory at 1.2150 has become strong enough to prevent further southwards journey, but it is likely that the journey would eventually continue. Once the accumulation territory is breached to the downside, the market would target another accumulation territory at 1.2050.
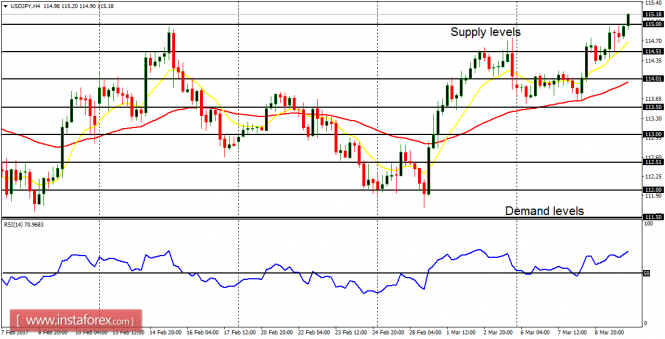
USD/JPY: On this pair, price managed to break upwards on Wednesday and things have become really bullish. Price has gone above the demand level at 115.00, going towards the supply level at 116.00 (which is the next target). EMA 11 is above the EMA 56, and the RSI period 14 is above the level 50. There is a clear Bullish Confirmation Pattern in the chart.
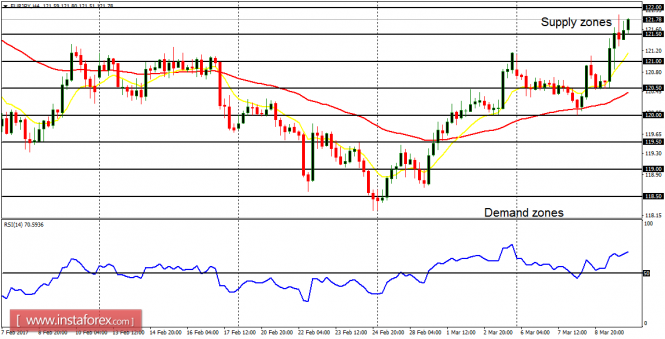
EUR/JPY: The EUR/JPY has moved above the demand zone at 121.50, going towards the supply zone at 122.00. There is a Bullish Confirmation Pattern in the 4-hour chart, and the price would most probably continue to go upwards.