
Technical outlook:
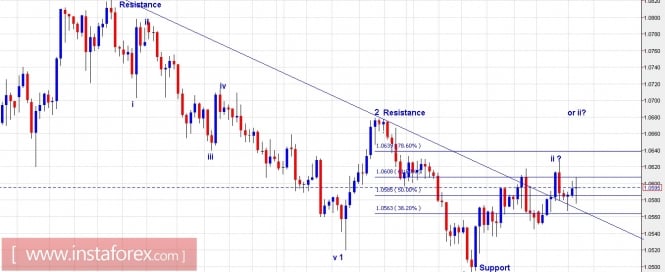
EUR/USD, 4H chart has been depicted here with probable wave counts for a medium-term outlook. The pair is showing resilience at the moment and not breaking below 1.0490 level. The most probable wave structure indicates that the pair is into its wave 3 drop, which should subdivide into 5 waves. Out of which waves i and ii have already taken shape and EUR/USD is ready to plunge lower towards 1.0300 and further. As an alternate though, the pair can produce an extended flat where wave ii terminates close to 1.0700 levels as depicted above. In either cases, watch out for EUR/USD dropping lower during New York live today or tomorrow. Immediate resistance is set at 1.0680 level for now, while support is seen at 1.0490 levels respectively. Also note that the pair is testing the resistance trend line and Fibonacci 0.618 resistance levels respectively.
Trading plan:
Please remain short now and also look to add further on rallies towards 1.0700, stop at 1.0850, target is 1.0000.
USD/JPY chart setups:
Technical outlook:
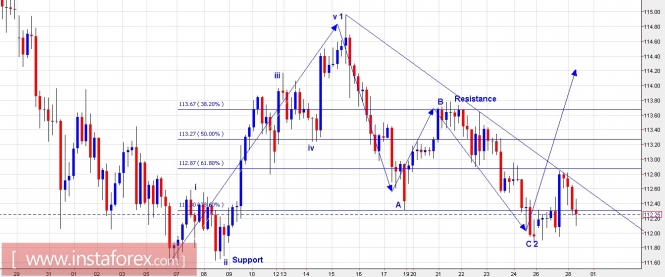
The 4H chart has been depicted to understand its intermediary wave counts. Since early February 2017, the pair has produced an impulse, wave 1, sub divided into 5 waves. Furthermore, a corrective A-B-C has followed as wave 2 and the pair has bounced off the Fibonacci 0.786 support as seen here. If this wave count holds true, the prices should continue rallying into wave 3 and unfold into 5 waves. Please note that unless the prices stay above 111.60 level, high probability remains for the bulls to take back control and push the prices towards 117.00 level at least. A break above 113.00 level is required to confirm that a meaningful bottom is in place. Immediate resistance is seen at 113.60 level, while support is at 111.60 level respectively. Buying on dips remains a safe trading strategy.
Trading plan:
Please remain long now, stop at 111.60 level, target is at 117.00 level.
Fundamental outlook:
A series of important fundamental data lined up to be coming out in the New Your Session promises to be a volatile day.
USD Gross Domestic Product (Annual), forecast 2.1%, USD GDP Price Index at 2.1%, also Advance Goods Trade Balance at -$66.0b scheduled at 08:30 am EST. Also Trump's speech today to the Congress is very important to set the trends for March 2017.
Good luck!
The material has been provided by InstaForex Company - www.instaforex.com