
Despite the new high yesterday gold was weak and closed below $1,255 after heavy selling pressures. Despite the pullback the price remains in an uptrend. Even a pullback towards $1,245 will not harm our bullish view and target of $1,280-$1,320.
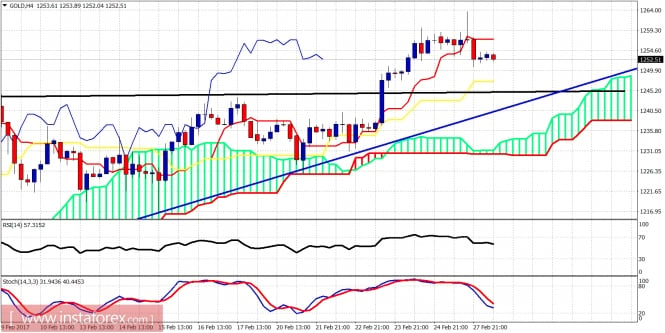
Blue line - long-term trendline support
Gold is trading above the 4-hour Ichimoku cloud support. The price has broken above resistance at $1,245 and we cannot rule out a back test of that area which is now support. The price has broken below the tenkan-sen (red line indicator). Short-term resistance is at $1,257 and support is at $1,247.
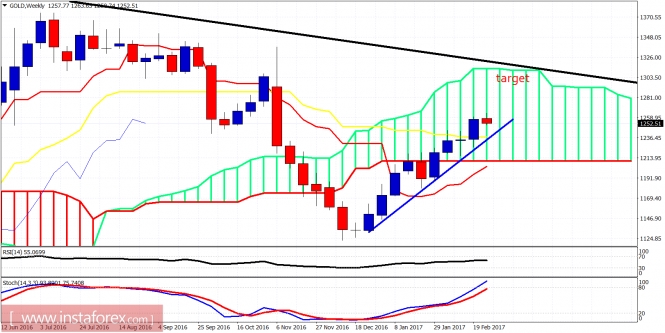
Blue line - long-term support
The price is trading above the blue trendline support and targets the upper cloud boundary and the black trendline resistance at $1,300. The price is above the weekly kijun-sen (yellow line indicator). Short-term trend is bullish. Oscillators have no worrying signs yet and still are not in overbought levels. Upside move in Gold is far from over.
The material has been provided by InstaForex Company - www.instaforex.com