
The pair plummeted after BoE's interest rate decision, despite the neutral stance seen and now it's testing the support zone of 1.2427, where also lies the 200 SMA at H1 chart. If GBP/USD manages to rebound above that moving average, then we can expect a re-testing of the 1.2718 level across the board, while another lower extension should take the Sterling to test the 1.2420 zone.
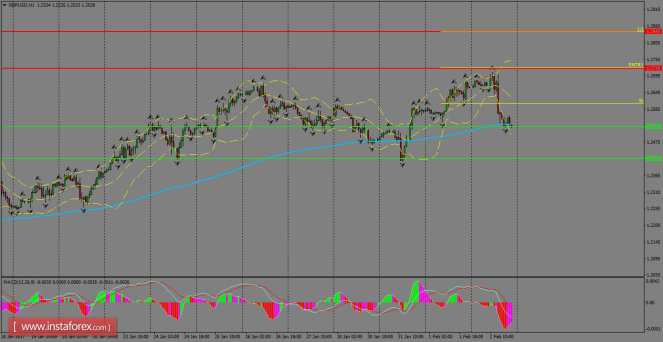
H1 chart's resistance levels: 1.2718 / 1.2840
H1 chart's support levels: 1.2527 / 1.2420
Trading recommendations for today: Based on the H1 chart, buy (long) orders only if the GBP/USD pair breaks a bullish candlestick; the resistance level is at 1.2718, take profit is at 1.2840 and stop loss is at 1.2601.
The material has been provided by InstaForex Company - www.instaforex.com