
Bitcoin dropped after failing to make a new higher high. Actually, it has reached a strong supply zone, so the current drop is natural. I've told you in my previous analysis that, BTC/USD could come back down towards the previous former lows trying to accumulate more bullish energy before jumping higher.
BTC/USD dropped by 5.53% from 57,652 today's high to 54,462.45 today's low. Its current sell-off is far from being over, so a further drop is in cards. Technically, it's almost to reach a strong demand zone, a bullish pattern printed here could announce that the downside movement is over.
BTC/USD dropped as expected
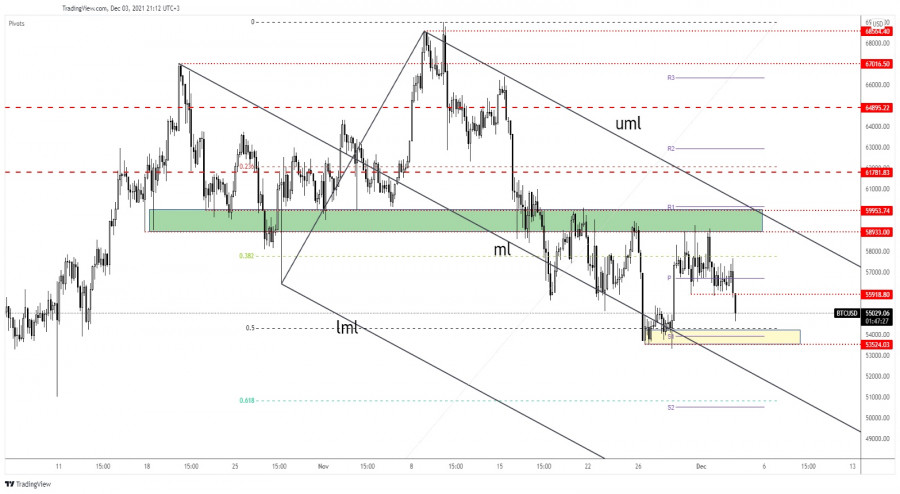
BTC/USD announced a potential downside movement after failing to stabilize above the weekly pivot point of 56,710.94. As I mentioned in my previous analysis, Bitcoin could come back down towards the 50% retracement level and down towards 53,524.03 static support if it closes below 55,918.80.
After registering only false breakouts above 58,933, a temporary downside movement was somehow expected. Also, its failure to approach and reach the Descending Pitchfork's upper median line (uml) signaled some pressure and a potential drop towards the median line (ml).
BTC/USD outlook
The level of 53,524.03 stands as static support. Ignoring this downside obstacle may signal a further drop to the Descending Pitchfork's median line (ml) at least. Staying above the static support zone may signal potential sideways movement between 53,524.03 and 58,933 levels.
Closing and stabilizing below 53,525.03 may announce a potential larger corrective phase. It could drop along the median line (ml). Only a strong bullish pattern in this support zone may announce a new upside movement.
The material has been provided by InstaForex Company - www.instaforex.com