
Bitcoin price is trading around $57,000. Price is showing signs of strength and is very close to confirming a bearish channel break out. There are increased chances that the decline from $68,959 is complete and that price has started a counter trend bounce.
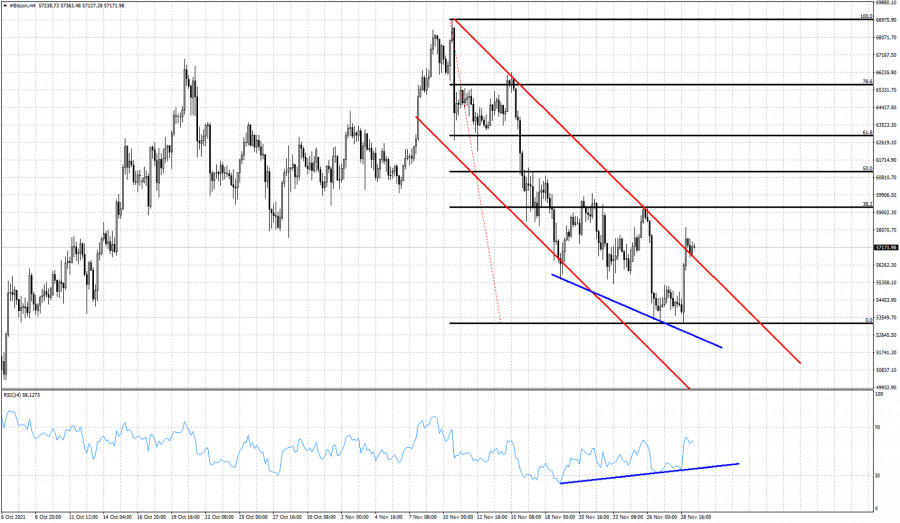
Blue lines- bullish divergence
Black lines - Fibonacci retracements
Bitcoin is still below the recent high at $59,368. This is the most important short-term resistance level. Breaking above it will open the way for a move towards the 61.8% retracement level and the $63,000 price. The decline from recent all time highs has lost its strength. The RSI is providing bullish divergence signals and this is an important warning. Although in the short-term I see price bouncing higher towards $62,000-$63,000, there are increased chances of a lower high to be formed.
The material has been provided by InstaForex Company - www.instaforex.com