
Gold price at the last session of the previous week has provided us with a bearish signal. Price broke down below the trading range it was in and also made a new lower low after providing a lower high. Gold is expected this week to at least start trading even lower towards $1,830.
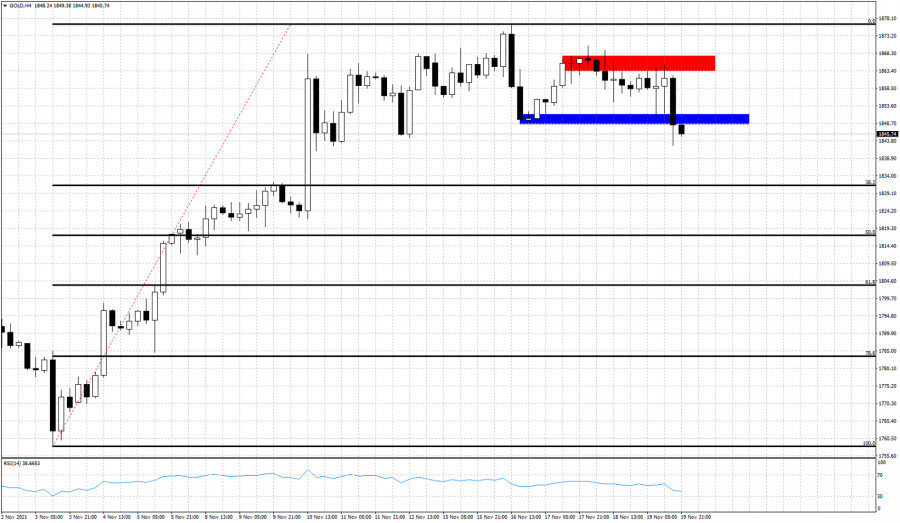
Blue rectangle - support
As we mentioned in our previous analysis, Gold's most probable path would be to the downside towards $1,800. But Gold first needed to break the blue rectangle horizontal support and lower trading range boundary. Gold price tested $1,850 two times and both times price bounced strongly upwards towards the upper trading range boundary. But the key resistance (red rectangle) was not broken. Gold instead turned lower and made new short-term lower lows. Our first short-term target is the 38% Fibonacci retracement level at $1,831. Next we could see Gold even towards the 61.8% retracement level just above $1,800. We remain bearish Gold.
The material has been provided by InstaForex Company - www.instaforex.com