
EUR/USD 5M
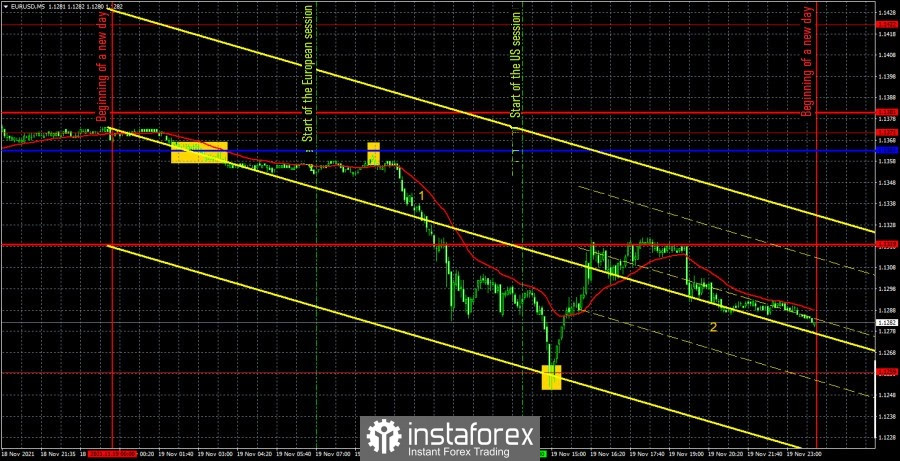
The EUR/USD pair fell again during the last trading day of the week. Not that this has happened to it often in recent months, however, it has happened, and in recent weeks even often. As we have already said in fundamental articles, in the last two weeks there has been such a fundamental background that is both not in favor of the euro and in favor of the dollar. Thus, the pair's fall, strong and unexpected, should not be surprising. The only problem was that it was very difficult to predict the beginning of this fall, since it was not based on any particular event. Of the important events on Friday, only two speeches by European Central Bank President Christine Lagarde can be noted. Her rhetoric has not changed at all compared to previous speeches, of which there were four last week. And although there is no direct correlation between the euro's fall on Friday and Lagarde's speeches, it can still be assumed that the mood of traders is now "bearish", not least because of the rhetoric of the ECB head. It remains for us to deal with Friday's trading signals and there are some very interesting points here. First of all, I would like to note that formally a sell signal was not formed at the European trading session. The price was approaching the critical line, but did not reach it by 2 points. The second thing to note is that a sell signal was formed, but at night. And these two points should be combined with each other in the morning to make the right decision. At the time of the opening of the European trading session, the price was not far from the night signal, so this moment in principle allowed us to take a risk and open shorts. And after the price approach to the Kijun-sen line, even more so. As a result, if traders opened short positions here, they earned about 80 points on them, as the price subsequently fell to the level of 1.1259. A buy signal was formed near the 1.1259 level, as the price bounced off it, which also turned out to be profitable. The pair rose to the resistance level of 1.1319, from which it rebounded. Therefore, at this moment it was necessary to close the longs. The profit was 36 points. Thus, in any case, a profit was made on Friday.
EUR/USD 1H
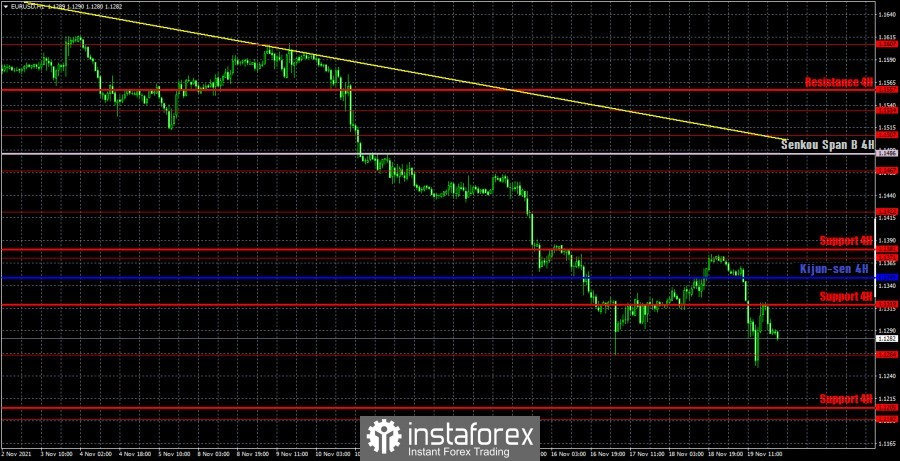
On the hourly timeframe, the downward trend persists, as the downtrend line remains relevant. The pair has corrected very weakly and has already resumed its downward movement. Therefore, we conclude that the bulls are now very weak. We highlight the following levels for trading on Monday - 1.1192, 1.1264, 1.1371, 1.1422, as well as the Senkou Span B (1.1486) and Kijun-sen (1.1349) lines. The Ichimoku indicator lines can change their position during the day, which should be taken into account when looking for trading signals. Signals can be rebounds or breakthroughs of these levels and lines. Do not forget about placing a Stop Loss order at breakeven if the price moves 15 points in the right direction. This will protect you against possible losses if the signal turns out to be false. There will be nothing interesting in the calendar of macroeconomic and fundamental events either in the United States or in the European Union on November 22. However, we draw your attention to the moment that the euro accelerated very well in its fall, so it can continue on Monday. You need to be ready for this.
We recommend you to familiarize yourself:
Overview of the EUR/USD pair. November 22. Another blow to the euro currency from Christine Lagarde.
Overview of the GBP/USD pair. November 22. The British pound fell with the euro.
Forecast and trading signals for GBP/USD for November 22. Detailed analysis of the movement of the pair and trade deals.
Analysis of the COT report
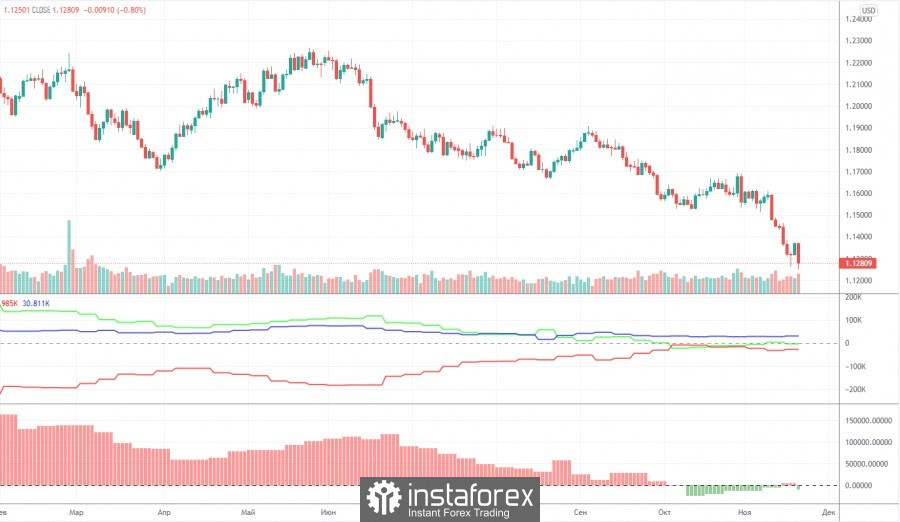
The mood of non-commercial traders changed quite significantly during the last reporting week (November 9-15). A group of non-commercial traders opened 7,000 buy contracts (longs) and 20,500 sell contracts (shorts) during the week. Thus, the net position for professional traders decreased by 13,500, and the mood became more "bearish". It should be noted that the European currency has dropped quite seriously over the past few weeks. But the net position for the "non-commercial" group, starting from October, practically does not change. This is signaled by the green line of the first indicator in the chart above. Almost all this time, it has been near the zero level, indicating the absence of serious changes in the mood of major players. Thus, if the general trend remains the same - over the past ten months, large players have seriously reduced the number of longs and increased the number of shorts, then in the past few weeks nothing of the kind has been observed, and the European currency was still falling. This suggests that what is happening on the market now does not quite correspond to the actions of large players. The second indicator (the net position for professional traders in the form of a histogram) shows that in the last six weeks the mood of traders has become less bearish, that is, in theory, at this time the euro should have been growing, not falling. Thus, if we draw a conclusion only on the basis of the Commitment of Traders (COT) reports, then a further fall in the euro currency is completely unclear.
Explanations for the chart:
Support and Resistance Levels are the levels that serve as targets when buying or selling the pair. You can place Take Profit near these levels.
Kijun-sen and Senkou Span B lines are lines of the Ichimoku indicator transferred to the hourly timeframe from the 4-hour one.
Support and resistance areas are areas from which the price has repeatedly rebounded off.
Yellow lines are trend lines, trend channels and any other technical patterns.
Indicator 1 on the COT charts is the size of the net position of each category of traders.
Indicator 2 on the COT charts is the size of the net position for the non-commercial group.
The material has been provided by InstaForex Company - www.instaforex.com