
SPX
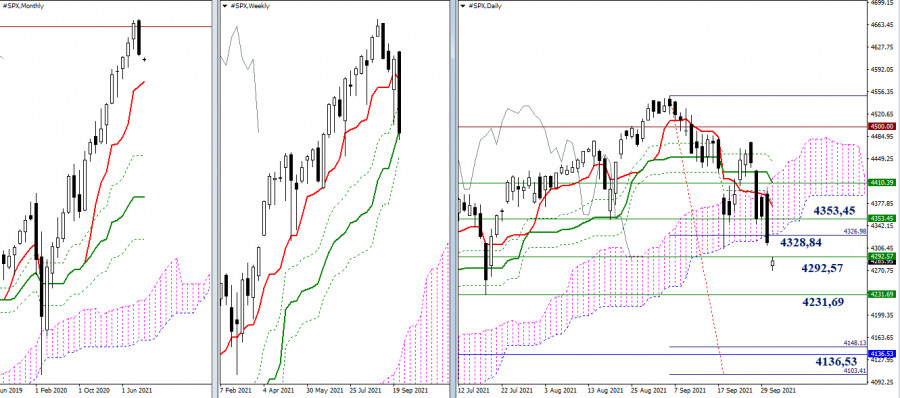
September will make the US major stock market index history as a bearish Harami pattern. The September candlestick has all the main features of this candlestick pattern and is distinctly bearish. After months of a bullish offensive and winning streak, the bears came out with their own plans. Consequently, October may confirm a further development and strengthening of bearish potential. Let's observe what targets the downside players have for today. First, they have to eliminate the weekly golden cross, the support of which they are currently testing at 4292.57 (weekly medium-term trend). The final level of the weekly Ichimoku cross is now at 4231.69. Further downside interests will be focused on the realization of a monthly downtrend correction to a short-term trend support (4136.53). The monthly Tenkan is now reinforcing the daily target to break the cloud (4148.13 - 4103.41), so a decline to the first monthly support (4136.53) will lead to the simultaneous realization of the daily target. The nearest resistance in case the upside players return to the market in the current situation can be observed at 4328.84 (daily cloud) and 4353.45 (weekly Fibo Kijun).
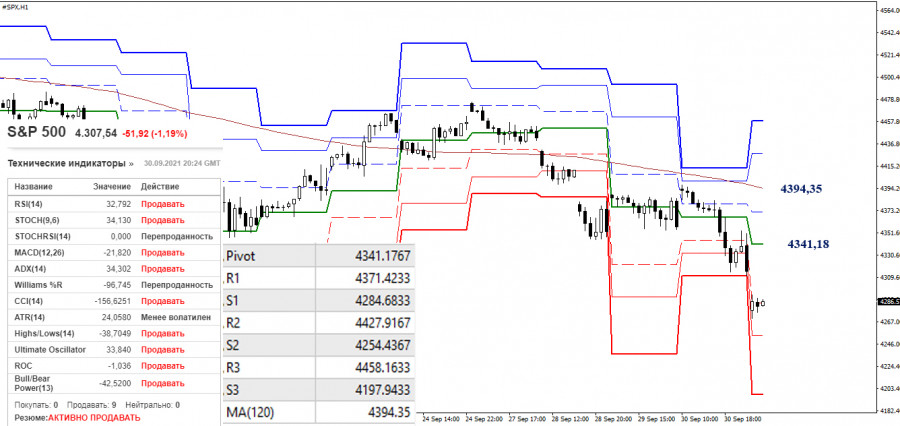
Today, bearish outweighing forces on the lower time frames support all analyzed technical tools. The first classic pivot level (4284.68) currently has the attraction and support to the price chart; further supports of classic pivot levels are located at 4254.44 and 4197.94. The key levels of the lower time frames are used as resistance, being now at 4341.18 (central pivot level) and 4394.35 (weekly long-term trend). To change the balance of power on the lower time intervals, the upside players need to overcome the resistance of the key levels.
***
Technical analysis is used:
Senior timeframes - Ichimoku Kinko Hyo (9.26.52) + Fibo Kijun levels
H1 - Pivot Points (classic) + Moving Average 120 (weekly long-term trend)
The material has been provided by InstaForex Company - www.instaforex.com