
EUR/USD 5M
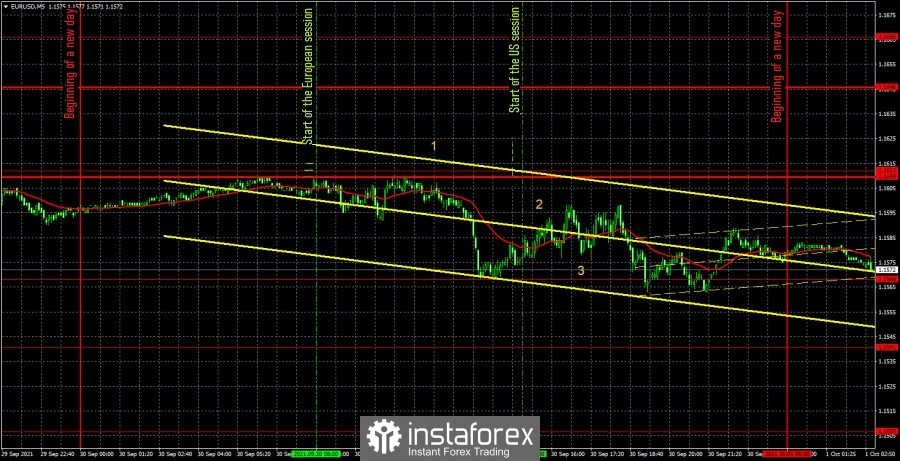
The EUR/USD pair was trading in its best traditions of the last few months on Thursday: low volatility, almost complete absence of trend movement. Thus, trading was not very convenient on Thursday. But this did not have to be done, since not a single trading signal was generated during the whole day. The pair was close to the extremum level of 1.1612 for a long time, but it could not work it out. Thus, the slight decline that happened at the European trading session did not work out. The volatility of the pair reached around 40 points again, which also did not contribute to active trading. But with the macroeconomic background, the situation has become a little better than in the previous days. Recall that during the first three trading days of the week, the markets witnessed almost a dozen speeches by Powell, Lagarde and Yellen, but did not receive any new information from them. Powell and Yellen also had regular speeches yesterday, with the same success. In addition, the European Union published a report on unemployment (figure "1" in the chart), which did not interest the markets at all. In America, a report on GDP for the second quarter was published not in the first estimate and with a marginal deviation from the forecast (figure "2" in the chart). The number "3" marks the time when Powell and Yellen started speaking. Thus, if we consider the pair's movement by 15 points as a "reaction", then any event is reflected in the foreign exchange market. But even in this case, the movements that were, simply do not coincide with the time when the reports were published.
EUR/USD 1H
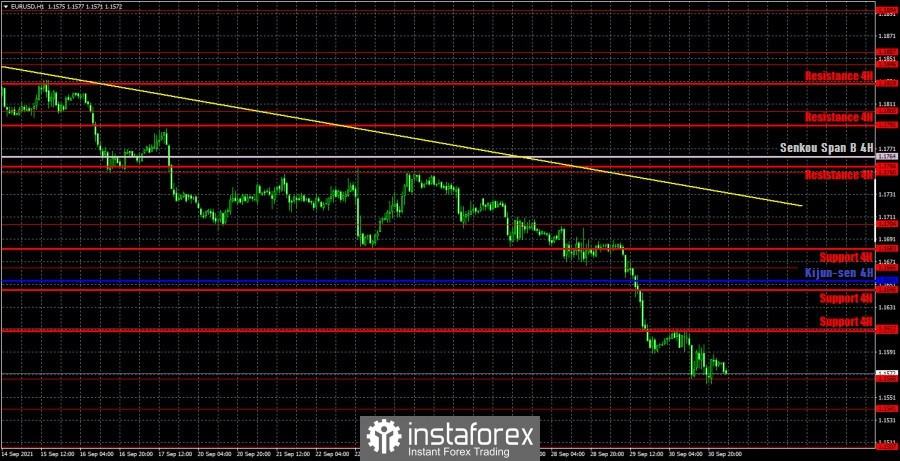
You see that the euro/dollar pair continues to move down on the hourly timeframe. However, if yesterday we talked about a slight strengthening of this movement, today it is already about its weakening. Quotes move away from the trend line, which is still relevant, but it should be understood that this line does not have a large slope, so the current trend cannot be called strong. However, there is no reason to suppose the end of the downward trend now. Thus, the dollar continues to rise in price, which makes it very difficult to find an explanation from the point of view of the fundamental background. We highlight the following levels for trading on Friday - 1.1507, 1.1541, 1.1568, 1.1612, 1.1666, as well as the Senkou Span B (1.1764) and Kijun-sen (1.1654) lines. The Ichimoku indicator lines can change their position during the day, which should be taken into account when looking for trading signals. Signals can be rebounds or breakthroughs of these levels and lines. Do not forget about placing a Stop Loss order at breakeven if the price moves 15 points in the right direction. This will protect you against possible losses if the signal turns out to be false. There will be few important macroeconomic publications on October 1. Nevertheless, there will still be something. For example, the European Union will know the consumer price index for September, which, according to experts, may grow to 3.3% y/y, confirming the words of ECB President Christine Lagarde. In America, the level of income and expenditure of the US population and the index of personal consumption expenditure will be published. Also from overseas, there will be information on business activity indices and consumer sentiment from the University of Michigan. Each separately taken report can provoke a movement, however, if the actual values differ little from the forecasted ones, then the markets will not react.
We also recommend that you familiarize yourself with the forecast and trading signals for the GBP/USD pair.
COT report
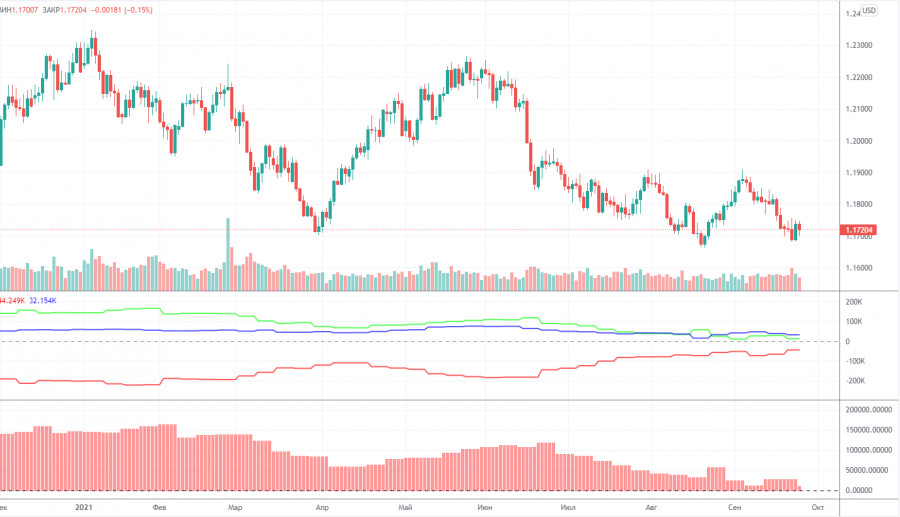
The mood of non-commercial traders became less bullish again during the last reporting week (September 14-20). This is eloquently signaled by the green line of the first indicator, which is responsible for displaying the net position of the "non-commercial" group of traders. Thus, the most important category of traders at this time continues to look towards short positions on the euro in the medium term. Nevertheless, they have not been able to go beyond the "zero line" for several weeks already. Thus, their sentiment does not change to bearish, and the pair cannot overcome the 1.1700 level. Consequently, everything rests not only on the level of 1.1700, but also on the mood of big traders who have been very reluctant to sell the euro in recent weeks. It is also clearly seen that their net position has been declining for a long time (second indicator), but at the same time it cannot become negative. As a result, the pair has been trading in the range of 1.1700 - 1.2300 for about nine months. While facing the horizontal channel, the movement for this period of time can not be called flat.
Explanations for the chart:
Support and Resistance Levels are the levels that serve as targets when buying or selling the pair. You can place Take Profit near these levels.
Kijun-sen and Senkou Span B lines are lines of the Ichimoku indicator transferred to the hourly timeframe from the 4-hour one.
Support and resistance areas are areas from which the price has repeatedly rebounded off.
Yellow lines are trend lines, trend channels and any other technical patterns.
Indicator 1 on the COT charts is the size of the net position of each category of traders.
Indicator 2 on the COT charts is the size of the net position for the non-commercial group.
The material has been provided by InstaForex Company - www.instaforex.com