
GBP/USD – 24H.
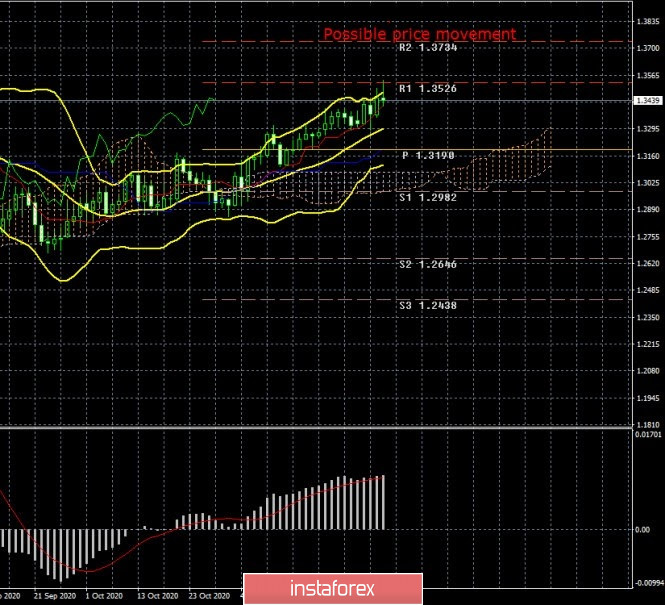
The GBP/USD currency pair has increased by about 100 points over the past week. Nevertheless, the upward trend, although not strong at the moment, is stable. There are almost no downward corrections, and the previous high from September 1 was updated. Formally, we now have the "double top" pattern at our disposal. However, we now recommend paying more attention to short-term trends and technical factors. The problem is the same as in the case of the euro/dollar pair. The fundamental background does not support the growth of the pound in any way. However, it is this currency that continues to grow steadily, although there are now a huge number of global problems in the UK. Nevertheless, market participants continue to sell the dollar. Last week, the pair's quotes worked out the first resistance level of 1.3526. It can provide serious resistance to buyers. However, as long as the upward trend continues, we recommend continuing to trade higher, despite the "foundation", "macroeconomics", COT reports, and other factors.
COT report.
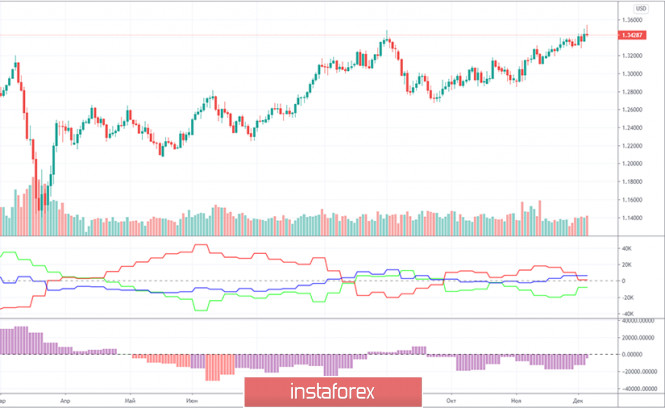
During the last reporting week (November 24-30), the GBP/USD pair did not grow or fall by a single point. In other words, there were no price changes during this period. But in general, there was still an upward trend, which continued into the next week. If in the case of the euro/dollar pair, we have long expected the beginning of a new downward trend, in the case of the pound/dollar pair, COT reports did not allow us to draw such conclusions. You only need to look at both indicators in the illustration to understand that there is no trend in the mood of major players. The first indicator constantly shows the change of mood of commercial and non-commercial traders from "bearish" to "bullish" and vice-versa. The second indicator constantly shows that the net position of the "Non-commercial" group is growing and decreasing. In other words, no conclusions can be drawn about the future of the pair based on COT reports. During the reporting week, non-commercial traders opened 3.6 thousand new purchase contracts and closed 4.4 thousand sales contracts. That is, the net position increased by 8 thousand at once, which is a lot for the pound. But there were no price changes. The number of open buy and sell contracts for the "Non-commercial" group is almost the same.
The fundamental background for the GBP/USD pair remained discouraging last week. Throughout the trading week, participants in the negotiation process made it clear that "everything should be resolved in the coming days" and "the negotiations have entered a crucial phase". However, no official statements were made again. On Friday, Michel Barnier has traditionally announced the continuation of negotiations, however, information was received from a member of the government about the deterioration of the atmosphere at the talks. According to the unnamed MP, the European Union has started to introduce new items, which worsens the prospect of signing the agreement. According to London, because of Brussels, progress in the negotiations has rolled back by 24 hours. On Friday, the pair's quotes fell slightly in price. But in general, it cannot be said that this was due to the appearance of another tension in the negotiations on a trade deal. However, now it is very difficult to understand what guides traders when making trading decisions. First of all, of course, we are interested in major traders who set the tone for trading. For example, on Friday, the States also published quite important statistics that were not in favor of the US currency (NonFarm Payrolls report). But in the second half of the day, it was the dollar that rose in price. Most likely, there was a purely technical correction, traders simply decided to fix some of the long positions to withdraw profits. However, even in this case, the correction was extremely weak. In general, the upward trend continues, and we recommend starting from this fact in trading.
Trading plan for the week of December 7-11:
1) The upward movement continues in recent weeks. The maximum from September 1 was updated, and the "double top" pattern may be formed. However, the fundamental background continues to confuse, which does not support the British pound. Thus, for the time being, upward trends remain more preferable for working out on lower timeframes, but we continue to expect the end of the upward trend.
2) Sellers now remain quite weak. Some hopes are associated with a rebound from the resistance level of 1.3526. However, in any case, to start trading for a decrease, you need to wait for the formation of a downward trend at least in the 4-hour timeframe. So far, there is a fairly strong upward movement. If the level of 1.3526 is overcome, the start of a new downward trend will be postponed indefinitely. Bears can still rely only on the fundamental background, however, it is not recommended to open shorts without technical confirmation.
Explanation of the illustrations:
Price levels of support and resistance (resistance/support) – target levels when opening purchases or sales. You can place Take Profit levels near them.
Ichimoku indicators, Bollinger bands, MACD.
Support and resistance areas – areas that the price has repeatedly bounced from before.
Indicator 1 on the COT charts – shows the net position size of each category of traders.
Indicator 2 on the COT charts – the net position size for the "Non-commercial" group.
The material has been provided by InstaForex Company - www.instaforex.com