
To open long positions on EUR/USD, you need:
In yesterday's afternoon forecast, I told buyers to go beyond the 1.1701 level, which happened. Let's take a look at the 5-minute chart and talk about where you could have entered long positions yesterday. The euro did not significantly rise when the 1.1701 level was tested from top to bottom, but it did produce a signal to buy the euro further along the trend, afterwards the bears tried to regain control of the market, but nothing happened. Returning to the 1.1701 level and testing it from top to bottom confirmed the presence of large buyers in the market, betting on the euro's growth.
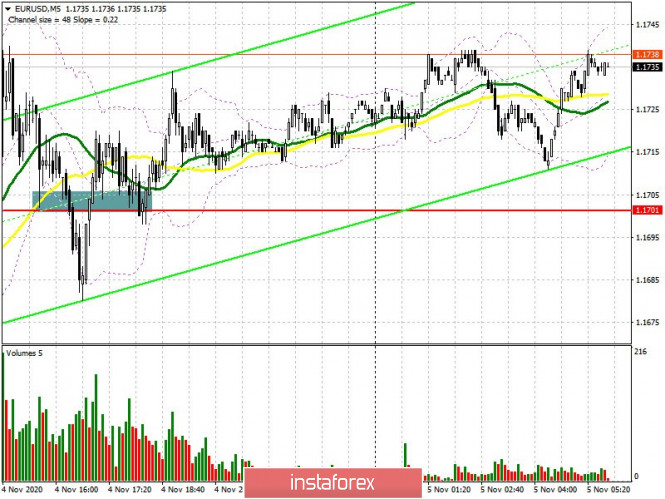
A buy signal will be processed as long as trading is carried out above 1.1701. The nearest target of the bulls is resistance at 1.1765, its breakout will powerfully push the pair upwards. However, this will happen most likely after the news that Biden is about to become the new president of the United States. Getting the pair to settle above 1.1765 and testing it from top to bottom, similar to yesterday's purchase, will lead to a new wave of EUR/USD growth in the area of highs of 1.1814 and 1.1864, where I recommend taking profit. In case the pair falls in the first half of the day, you can count on a false breakout in the support area of 1.1701, where the moving averages also pass, playing on the side of the euro buyers. If there is no activity at this level, I recommend opening long positions only on a rebound from the low of 1.1655, or from the lower border of the wide horizontal channel at 1.1604, counting on a 15-20 point correction within the day.
To open short positions on EUR/USD, you need:
Sellers have one simple task - to keep resistance at 1.1765, where a false breakout will be a signal to open short positions in the euro. A breakout of this range will lead to removing the bears' stop-orders, therefore, before selling the euro, make sure that a false breakout is taking place. Any advantage towards Trump in Nevada, while on Biden's side, could increase demand for the US dollar. The primary task of the bears in these conditions is to return and settle below support at 1.1701, testing it from the bottom up forms a good entry point for short positions, in hopes to bring back the bear market and for the pair to fall to the 1.1655 support. The 1.1604 level will be the next target, where I recommend taking profits. A breakthrough will take place only if Trump wins the US presidential election. In case bears are not active at 1.1765, I recommend postponing short positions until the 1.1814 high has been updated, or sell EUR/USD immediately upon a rebound from the 1.1864 resistance, counting on a 15-20 point correction within the day.
The Commitment of Traders (COT) report for October 27 showed a reduction in both long and short positions. Despite this, buyers of risky assets believe that the bull market will continue and so they prefer to act with caution. Thus, long non-commercial positions fell from 229,878 to 217,443, while short non-commercial positions also fell to 61,888 from 63,935. The total non-commercial net position decreased to 155,555 from 165,943 a week earlier. However, the bullish sentiments for the euro remains rather high in the medium term. The more the euro will decline against the US dollar at the end of this year, the more attractive it will be for new investors, especially following the US presidential elections, when additional pressure on the market on this issue eases.
Indicator signals:
Moving averages
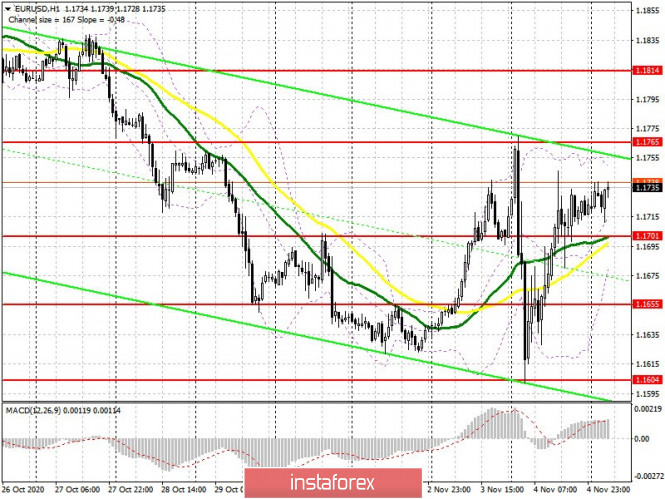
Trading is carried out just above 30 and 50 moving averages, which indicates an attempt by the bulls to take the initiative.
Note: The period and prices of moving averages are considered by the author on the H1 hourly chart and differs from the general definition of the classic daily moving averages on the daily D1 chart.
Bollinger Bands
A breakout of the upper border of the indicator around 1.1745 will lead to a new wave of euro growth. A breakout of the lower boundary of the indicator around 1.1695 will increase the pressure on the pair.
Description of indicators
- Moving average (moving average, determines the current trend by smoothing out volatility and noise). Period 50. It is marked in yellow on the chart.
- Moving average (moving average, determines the current trend by smoothing out volatility and noise). Period 30. It is marked in green on the chart.
- MACD indicator (Moving Average Convergence/Divergence — convergence/divergence of moving averages) Quick EMA period 12. Slow EMA period to 26. SMA period 9
- Bollinger Bands (Bollinger Bands). Period 20
- Non-commercial speculative traders, such as individual traders, hedge funds, and large institutions that use the futures market for speculative purposes and meet certain requirements.
- Long non-commercial positions represent the total long open position of non-commercial traders.
- Short non-commercial positions represent the total short open position of non-commercial traders.
- Total non-commercial net position is the difference between short and long positions of non-commercial traders.