
EUR/USD
Analysis:
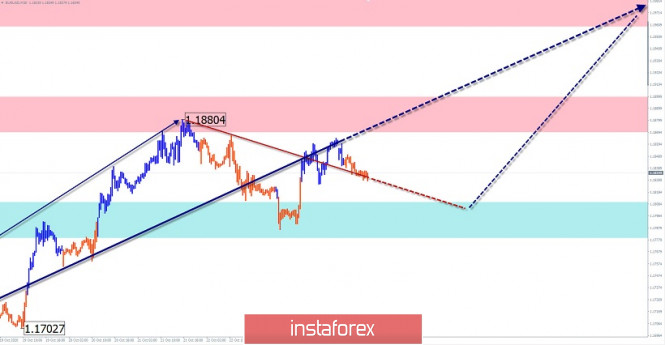
The trend of the European currency since March is directed to the north of the price chart. The last incomplete wave on the main course started on September 25. Its structure shows a clear zigzag (A-B-C). In the last section, an intermediate pullback has been developing since the middle of last week.
Forecast:
In the next trading session, you can expect a decline in the area of settlement support. By the end of the day, a reversal and return to the upward movement vector are expected. A breakout of the upper limit of the nearest resistance is not excluded today.
Potential reversal zones
Resistance:
- 1.1960/1.1990
- 1.1870/1.1900
Support:
- 1.1810/1.1780
Recommendations:
Euro sales are risky today. It is recommended to refrain from entering the pair's market during the pullback and look for buy signals at its end.
AUD/USD
Analysis:
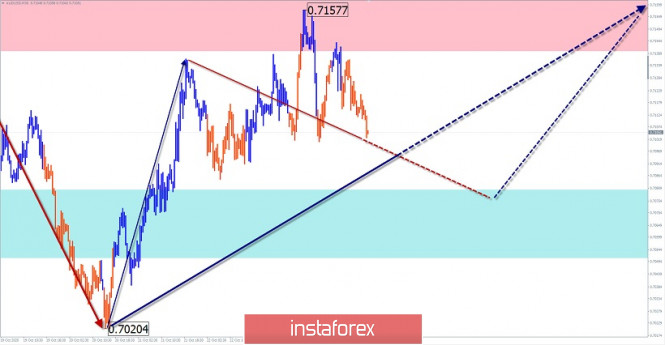
Since March, the Australian dollar market has been forming an upward momentum on a daily scale. Its last section counts down from September 25. During the entire current month, the price formed a correction (B). The bullish segment of the chart from October 20 has a reversal potential. This may be the beginning of the final part (C).
Forecast:
A general flat mood is expected in the near future. In the European session, you can expect a price decline up to the support zone. By the end of the day, the probability of a reversal and re-ascent to the resistance area increases.
Potential reversal zones
Resistance:
- 0.7140/0.7170
Support:
- 0.7080/0.7050
Recommendations:
Trading the pair today is only possible within the intraday with a reduced lot. When selling, you should be prepared for counter price outliers. After the reversal signals appear, purchases of the instrument will become a priority.
Explanation: In the simplified wave analysis (UVA), waves consist of 3 parts (A-B-C). The last incomplete wave is analyzed. The solid background of the arrows shows the formed structure, and the dotted background shows the expected movements.
Note: The wave algorithm does not take into account the duration of the instrument's movements in time!
The material has been provided by InstaForex Company - www.instaforex.com