
The pair traded downward on Wednesday, into a pullback, but the news did not allow the bottom to be fully worked out. Today, the price may move upward. According to the economic calendar, euro news is expected at 07:55 and 10:00 UTC, and dollar news is at 12:30 and 14:00 UTC.
Trend analysis (Fig. 1).
The market may move upward from the level of 1.1723 (closing of yesterday's daily candlestick) with the target of 1.1766 - a 38.2% pullback level (red dotted line). Upon testing this level, the price may continue to move upward with the target at 1.1813 - a 50.0% pullback level (red dotted line).
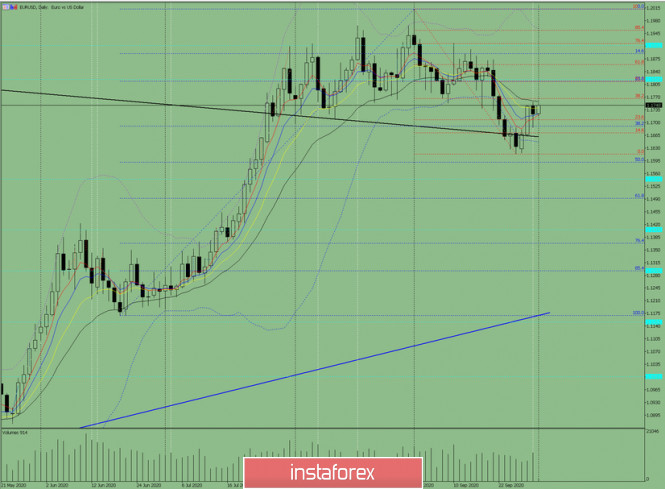
Figure: 1 (daily chart).
Comprehensive analysis:
- Indicator analysis - up;
- Fibonacci levels - up;
- Volumes - up;
- Candlestick analysis - up;
- Trend analysis - up;
- Bollinger lines - up;
- Weekly chart - up.
General conclusion:
Today, the price may move upward from the level of 1.1723 (closing of yesterday's daily candlestick) with the target of 1.1766 - a 38.2% pullback level (red dotted line). Upon testing this level, the price may continue to move upward with the target at 1.1813 - a 50.0% pullback level (red dotted line).
Another possible scenario: from the level of 1.1723 (closing of yesterday's daily candlestick), the price may continue to move upward with the target of 1.1758 - a 21-day EMA (black thin line). Upon testing this line, the price may decline to at least 1.1690 - a 38.2% pullback level (blue dashed line).
The material has been provided by InstaForex Company - www.instaforex.com