
Trend analysis (Fig. 1).
The market may continue to move upward from the level of 1.1939 (closing of yesterday's daily candle) with the target at 1.2104 - a 76.4% pullback level (blue dotted line). From here, the price may continue to move upward with the next target at 1.2275 - an 85.4% pullback level (blue dotted line).
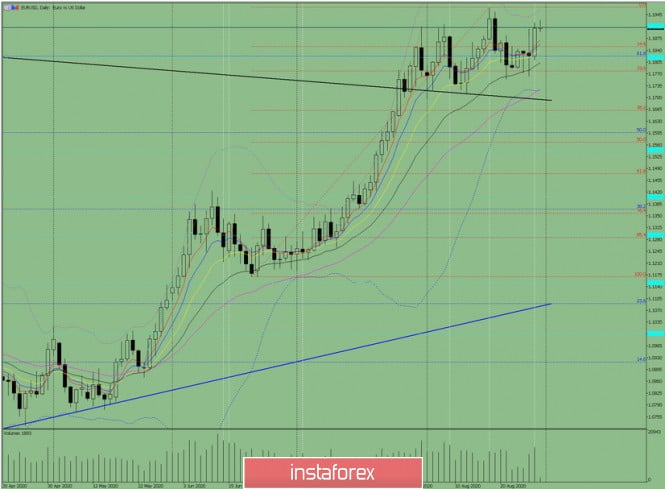
Figure: 1 (daily chart).
Comprehensive analysis:
- Indicator analysis - up;
- Fibonacci levels - up;
- Volumes - up;
- Candlestick analysis - up;
- Trend analysis - up;
- Bollinger lines - up;
- Weekly chart - up.
General conclusion:
Today, the price may continue to move upward from the level of 1.1939 (closing of yesterday's daily candle) with the target at 1.2104 - a 76.4% pullback level (blue dashed line).
Another possible scenario is upon reaching 1.2102 - a 76.4% pullback level (blue dashed line), the price may move down with the target of 1.1966 - a 14.6% pullback level (red dashed line).
The material has been provided by InstaForex Company - www.instaforex.com