
To open long positions on GBP/USD, you need:
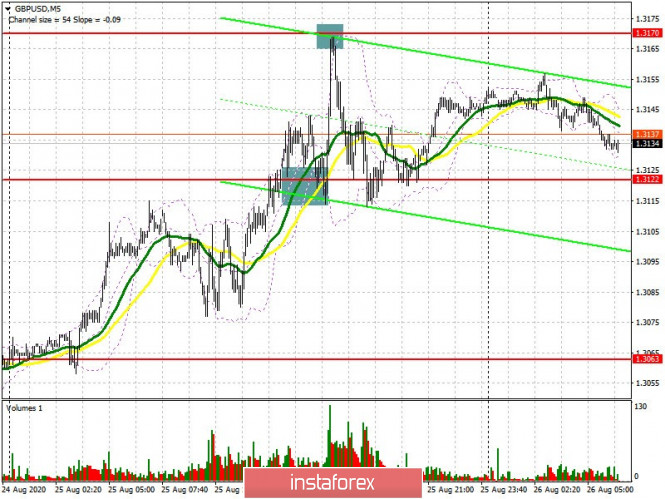
Several rather profitable signals formed yesterday, both to buy and sell the British pound, which we will now consider. If you recall yesterday's review, I paid attention to buying from the 1.3122 level in the afternoon. On the 5-minute chart, you can clearly see that after repeatedly testing the 1.3122 level, the signal to open long positions appeared, which caused GBP/USD to rise to the resistance area of 1.3170, from which I recommended selling the pair immediately for a rebound. As a result, it was possible to pick up the movement, and then the same number of points down. Such days are rare, but they do happen. Nothing has changed today from a technical point of view. Bulls need to protect the 1.3115 level, since a false breakout there will be the only signal to continue buying the pound in anticipation of a repeated return to the resistance of 1.3170. There are also moving averages in the 1.3115 area, which can provide additional support for the pair. A breakout and consolidating GBP/USD above the resistance of 1.3170 will be the long-term goal, which forms the entry point to buy in anticipation of updating the 1.3218 level, where I recommend taking profits. If bulls are not active in the 1.3115 area, and since we do not have fundamental data to focus on today, it would be best to postpone purchases until the lower border of the 1.3063 side channel has been updated and open long positions from there immediately for a rebound based on a correction of 35-40 points within the day.
You also need to take note of the Commitment of Traders (COT) reports for August 18, which showed a growth in long positions, as well as the reduction of short ones. The COT report indicates that short non-commercial positions decreased from 59,874 to 47,806 during the week. On the contrary, long non-commercial positions increased from the level of 48,053 to the level of 54,310. As a result, the non-commercial net position became positive and reached 6,504, against – 2,821. This suggests that the market trend has changed and from an investment point of view, it has become more attractive and interesting to buy the pound with its decline.
To open short positions on GBP/USD, you need:
The main task of the bears in the morning is to return the 1.3115 level under their control, which they failed to do yesterday. At least the 1.3170 resistance was defended. A sell signal for the pound can only be formed in this scenario, however, before selling, be sure to wait until GBP/USD returns to 1.3115 and test this area from the bottom up, which will form an entry point into short positions. The plan is to fall to the support area of 1.3063, where I recommend taking profits. In case the pair grows further, I recommend considering new short positions only after updating the high of 1.3170, or immediately on a rebound from the larger resistance of 1.3218 based on a correction of 20-30 points within the day.
Indicator signals:
Moving averages
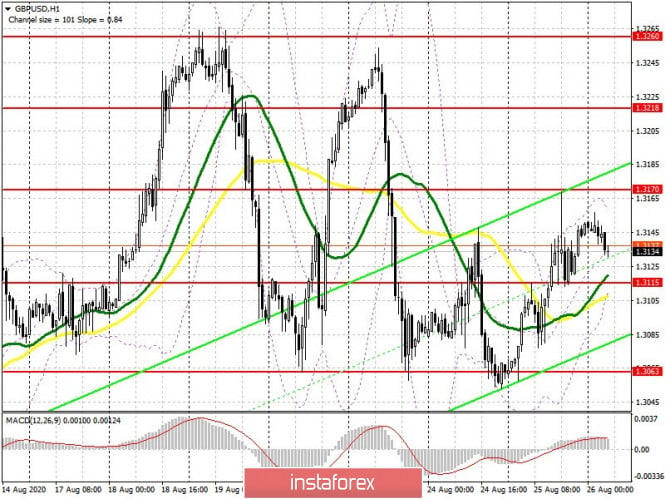
Trading is carried out slightly above 30 and 50 moving averages, which indicates an active opposition of buyers and sellers for the further direction of the market.
Note: The period and prices of moving averages are considered by the author on the H1 hourly chart and differs from the general definition of the classic daily moving averages on the D1 daily chart.
Bollinger Bands
A break of the lower border of the indicator around 1.3115 will increase the pressure on the pound. A breakout of the upper border of the indicator around 1.3160 will cause the pair to grow higher.
Description of indicators
- Moving average (moving average, determines the current trend by smoothing out volatility and noise). Period 50. It is marked in yellow on the chart.
- Moving average (moving average, determines the current trend by smoothing out volatility and noise). Period 30. It is marked in green on the chart.
- MACD indicator (Moving Average Convergence/Divergence — convergence/divergence of moving averages) Fast EMA period 12. Slow EMA period to 26. SMA period 9
- Bollinger Bands (Bollinger Bands). Period 20
- Non-commercial traders are speculators, such as individual traders, hedge funds, and large institutions that use the futures market for speculative purposes and meet certain requirements.
- Long non-commercial positions represent the total long open position of non-commercial traders.
- Short non-commercial positions represent the total short open position of non-commercial traders.
- Total non-commercial net position is the difference between short and long positions of non-commercial traders.