
To open long positions on EUR/USD, you need:
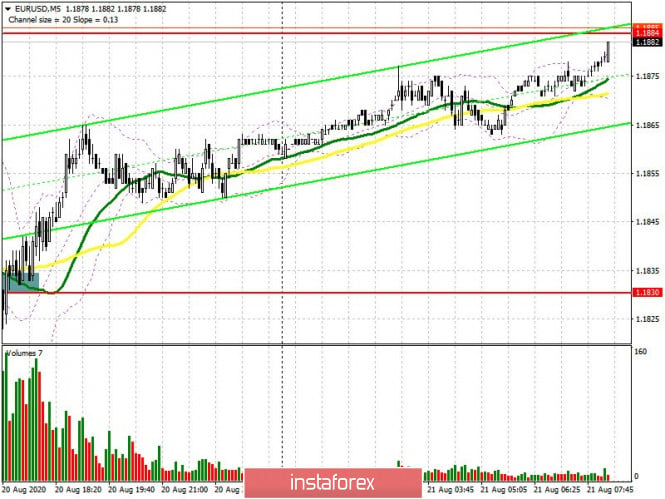
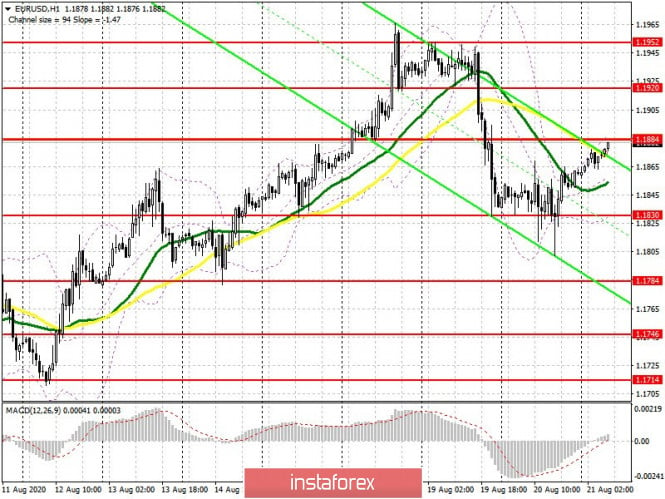
Yesterday, buyers have been actively defending the 1.1830 level all day and this is clearly seen on the hourly chart. The closing price turned out to be either at or above the level each time, which only strengthened the belief in the euro's recovery after a major fall on Wednesday. Weak data on the US labor market resulted in the pair's growth in the second half of the day. If you look at the 5-minute chart, you will see how several entry points to long positions have formed. If I analyzed the first point in the morning forecast, then another unsuccessful attempt by bears to break below 1.1830 brought the pair back to this level in the afternoon, which led to forming a signal to open long positions. As a result, the movement was about 60 points up. As for the current situation on the market, it is quite possible that today buyers will once again have to protect the support of 1.1830, where only a false breakout will be a signal to open long positions. If there is no activity at this level, it is best to postpone purchases until the low of 1.1784 has been updated, where the pair could decline only after poor data on manufacturing activity and activity in the services sector of the eurozone. However, the reports are expected to be good, so we can expect the bullish momentum to continue. An equally important task for the bulls is to break through the resistance of 1.1884 and consolidate on it. Only this will allow you to regain the position of major players and open a direct path to the levels of 1.1920 and 1.1952, where I recommend taking profits.
Let me remind you that the Commitment of Traders (COT) reports for August 11 continued to record the growth of long positions and the reduction of short ones, which tells us about the continued interest of investors in risky assets, even at such high prices, as many bet on a further weakening of the US dollar. Problems are also piling up due to disagreements in the US Congress on the further approval of financial assistance to the unemployed, as well as the aggravation of US trade relations with China and the EU. The report shows an increase in long non-commercial positions from the level of 262,109 to the level of 266,078, while short non-commercial positions decreased from 81,461 to 66,327. As a result, the positive non-commercial net position sharply jumped to 199,751, up from 180,648 a week earlier, indicating an increase in interest in buying risky assets.
To open short positions on EUR/USD, you need:
Sellers failed to pick up support at 1.1830 yesterday, and you should seriously think about protecting resistance at 1.1884. A false breakout at this level along with weak data composite PMI Eurozone forms a signal for opening short positions in anticipation for another decline to 1.1830, which bears so actively fought yesterday. However, it will be possible to talk about continuing the downward correction only after sellers consolidate below the 1.1830 level, which will raise the pressure on the pair and open a direct path to the lows of 1.1784 and 1.1746, where I recommend taking profits. If EUR/USD continues to rise above the 1.1884 resistance in the morning, I recommend postponing short positions until the high at 1.1920 is renewed, or sell the euro immediately on a rebound from the 1.1952 weekly resistance, based on a correction of 25-30 points within the day.
Indicator signals:
Moving averages
Trading is carried out in the area of 30 and 50 moving averages, which indicates an active opposition and struggle for the further direction of the pair.
Note: The period and prices of moving averages are considered by the author on the H1 hourly chart and differs from the general definition of the classic daily moving averages on the daily D1 chart.
Bollinger Bands
In case the pair falls, support will be provided by the lower border of the indicator around 1.1830. A breakout of the upper border of the indicator in the 1.1884 area will result in the euro's growth.
Description of indicators
- Moving average (moving average, determines the current trend by smoothing out volatility and noise). Period 50. It is marked in yellow on the chart.
- Moving average (moving average, determines the current trend by smoothing out volatility and noise). Period 30. It is marked in green on the chart.
- MACD indicator (Moving Average Convergence/Divergence — convergence/divergence of moving averages) Fast EMA period 12. Slow EMA period to 26. SMA period 9
- Bollinger Bands (Bollinger Bands). Period 20
- Non-profit traders are speculators, such as individual traders, hedge funds, and large institutions that use the futures market for speculative purposes and meet certain requirements.
- Long non-commercial positions represent the total long open position of non-commercial traders.
- Short non-commercial positions represent the total short open position of non-commercial traders.
- The total non-commercial net position is the difference between short and long positions of non-commercial traders.