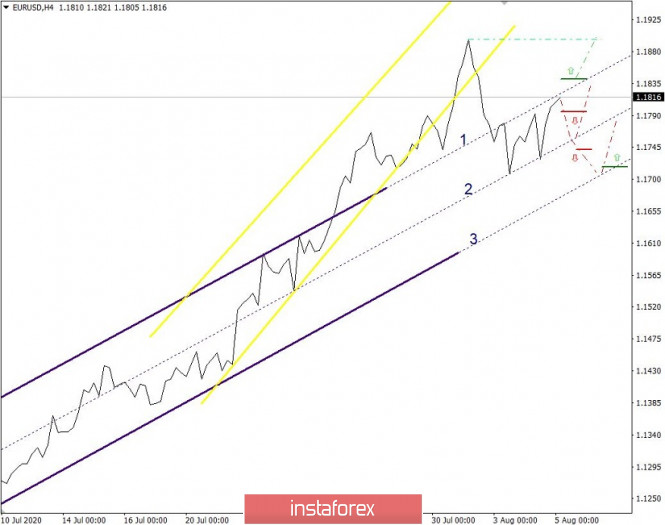
The EUR/USD currency pair follows the borders of the blue channel with surgical precision, where the role of resistance and support is played by the trend lines numbered 1 and 2, consistently producing a rebound.
Following the paths of the specified borders consistently brings profit, and this strategy is relevant until the trend lines are broken.
Based on the analysis of price behavior relative to trend lines, it can be assumed that the existing convergence with line number 1 (area of 1.1820/1.1830) can play the role of resistance, reversing the quote in the direction of trend line number 2 (1.1755/1.1765).
We considered one of the possible scenarios for the development of the market, but with the help of technical analysis, a trader can create options for alternative development in advance, which will help in any situation to be on the clock of the market.
Break of the trend line # 1 / # 2
There is nothing eternal in the market just like in life. Trends change sooner or later and price levels break through. Trend line number one (#1) may not play the role of resistance, and the slope of the ascending channel may change, as it happened in the history of the yellow channel.
Based on the above judgment, the alternative scenario with trend line #1 considers its breakdown if the price consolidates above 1.1840/1.1850. This development does not exclude an update of the local maximum on July 31 - 1.1900.
On the other hand, trend line # 2 is the middle part of the ascending channel (1 + 2 + 3), and its breakdown is a typical structure of the price movement from border 1 towards the lower frame 3.
Based on the logic of the behavior of market participants in the price channel, it can be assumed that if the quote is consolidated below 1.1745 / 1.1750, a full-fledged price movement from frame 1 to frame 3 (1.1700 / 1.1710) may well come.