
To open long positions on GBP/USD, you need:
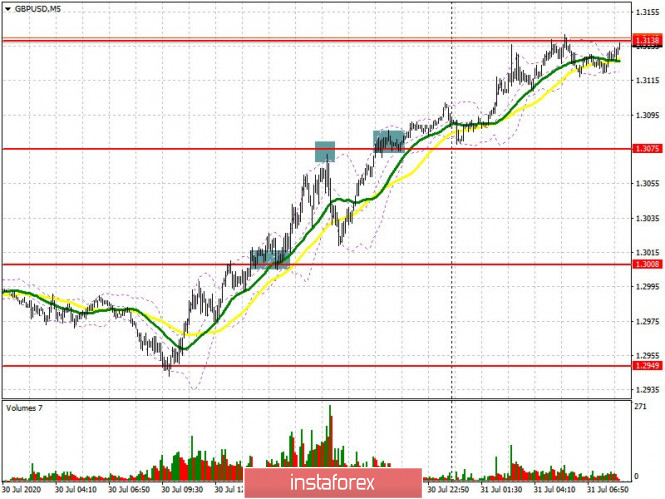
My fears about the possibility of a downward correction of the British pound were not justified. The US dollar's weakness continued to drive the pound to new highs. If you look at the 5-minute chart and remember my forecasts for yesterday morning, you will see how after the first point formed for entering the market at the breakdown and consolidating above the resistance of 1.3008, buyers very quickly tightened the pound to the resistance of 1.3075, where you could watch the sales. A repeated return to this range and its breakout formed a new signal to open long positions, as a result of which we hit the resistance of 1.3138, for which the main fight is now unfolding. Bulls need to exit above this level, which forms the next point for entering the purchase in anticipation of continuing the bull market to the high of 1.3192. The 1.3228 area will be the long-term target of the bulls, where I recommend taking profits. But a more interesting moment for opening long positions may be the downward correction of GBP/USD in the first half of the day to the support area of 1.3075. But it is best to make purchases there only after a false breakout has formed. I recommend opening long positions immediately for a rebound only after testing the low of 1.3009, counting on a correction of 30-40 points within the day. The moving averages are also located there.
In addition, you should take note that the Commitment of Traders (COT) reports for July 21 recorded another increase in short and long positions, and it is obvious that there are more bears, despite the active opposition of buyers of the pound. This suggests that the growth of the market is not due to the British pound's strength, but because of the US dollar's weakness. Problems with Brexit and uncertainty about the prospect of economic recovery have not gone away. The COT report indicates that there was an increase in short non-commercial positions from the level of 56,761 to the level of 61,310 during the week. Long non-commercial position increased from the level 43 to level 175 46 230. As a result, the non-commercial net position increased its negative value to -15,080 against -13,568, which indicates the likelihood of a sharp fall in the pound after the US dollar regains strength.
To open short positions on GBP/USD, you need:
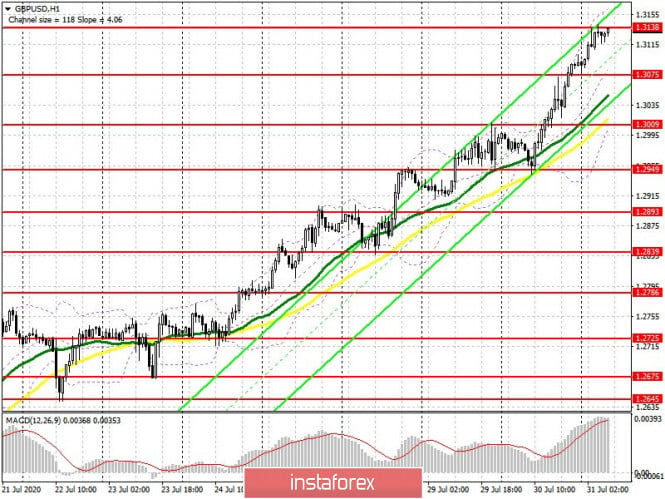
Sellers of the pound need to protect the resistance of 1.3138, since forming a false breakout there will be the first signal for a possible downward correction of the pair to the support area of 1.3075. An equally important task is to break through and consolidate under this range, which will lead to the demolition of a number of bull stop orders and a larger decline in GBP/USD to the support area of 1.3009, where the lower border of the current ascending channel passes. They recommend taking the profit. If bears are not active in the resistance area of 1.3138, I advise you to postpone short positions until the test of the high of 1.3192 or sell the pound immediately on the rebound from the larger resistance of 1.3228 in anticipation of a correction of 30-40 points within the day.
Indicator signals:
Moving averages
Trading is carried out above 30 and 50 moving averages, which indicates the continued growth of the pound.
Note: The period and prices of moving averages are considered by the author on the H1 hourly chart and differs from the general definition of the classic daily moving averages on the daily D1 chart.
Bollinger Bands
Growth will be limited by the upper level of the indicator in the area of 1.3145. In case the pair falls, support will be provided by the lower border of the indicator at 1.3009.
Description of indicators
- Moving average (moving average, determines the current trend by smoothing out volatility and noise). Period 50. It is marked in yellow on the chart.
- Moving average (moving average, determines the current trend by smoothing out volatility and noise). Period 30. It is marked in green on the chart.
- The MACD indicator (Moving Average Convergence/Divergence - convergence/divergence of moving averages). Fast EMA period 12. Slow EMA period to 26. The 9 period SMA.
- Bollinger Bands (Bollinger Bands). The period 20.
- Non-commercial speculative traders, such as individual traders, hedge funds, and large institutions that use the futures market for speculative purposes and meet certain requirements.
- Long non-commercial positions represent the total long open position of non-commercial traders.
- Short non-commercial positions represent the total short open position of non-commercial traders.
- The total non-commercial net position is the difference between short and long positions of non-commercial traders.