
To open long positions on EURUSD, you need:
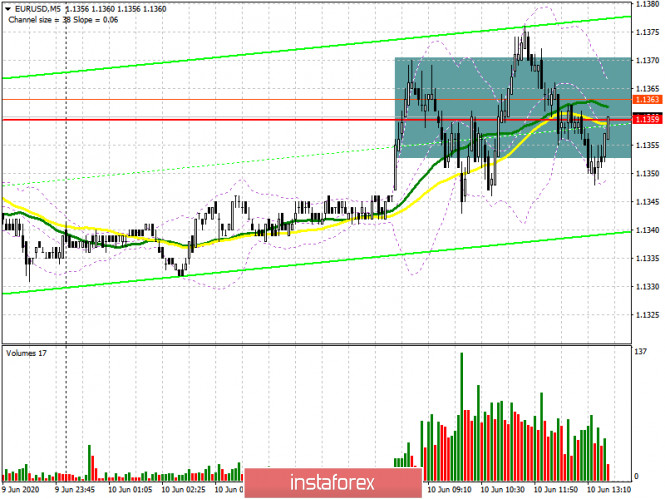
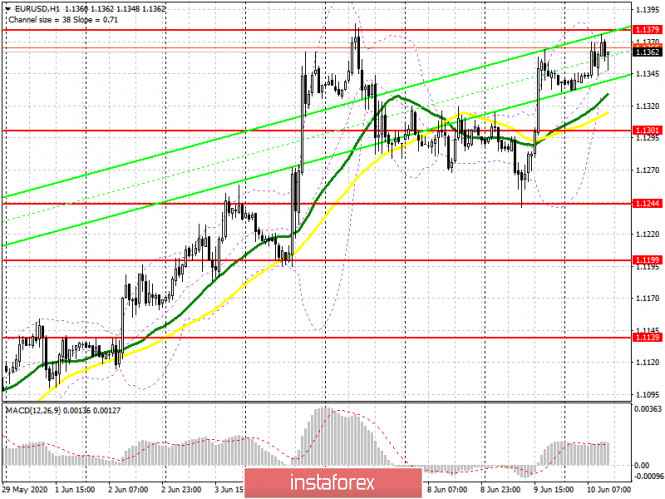
Even in the first half of the day, I paid attention to the level of 1.1359. Fixing above this range should have been a signal to open long positions, however, if you look at the 5-minute chart, the bulls did not manage to catch on to this range. On the first test of the top-down level, the price failed below 1.1359, which eventually led to the formation of a new resistance of 1.1379, which should be emphasized in the second half of the day. Only weak inflation data and the Fed's wait-and-see attitude with nondescript prospects for economic recovery in the 3rd quarter of this year will lead to a breakthrough and consolidation above resistance 1.1379, which will open buyers a direct path to the highs of 1.1422 and 1.1459 with a further target of 1.1487, where I recommend taking the profit. If the statements made by Fed Chairman Jerome Powell immediately after the publication of the Fed's decision will support the US dollar, it is best to consider new long positions in EUR/USD only after the formation of a false breakout in the area of 1.1301 or to open long positions immediately on a rebound from this week's low - 1.1244, counting on correction of 30-40 points within the day.
To open short positions on EURUSD, you need:
As for short positions in the euro, you need to be extremely careful with them. Only the formation of a false breakout in the resistance area of 1.1379 in the second half of the day will signal the opening of short positions in the pair, however, many traders will focus on the report on inflation in the US, which may significantly slow down, which will lead to another wave of growth in EUR/USD. In this scenario, it is best to count on short positions after updating the highs of 1.1422 and 1.1459 with the aim of a downward correction of 30-40 points within the day. However, it is likely that traders will ignore the report before the important decision of the Federal Reserve on interest rates. In the case of positive forecasts on the prospects of the economy, demand for the dollar could return. In this case, the bears' task will be to break through and consolidate below the support of 1.1301, which will increase pressure on EUR/USD and lead to a return to the lower border of the 1.1244 side channel, where I recommend fixing the profits. The entire upward trend formed on May 25 will depend on the breakdown of this level.
Signals of indicators:
Moving averages
Trading is just above the 30 and 50 daily moving averages, which indicates the probability of continued growth of the euro.
Note: The period and prices of moving averages are considered by the author on the hourly chart H1 and differ from the general definition of the classic daily moving averages on the daily chart D1.
Bollinger Bands
Volatility has decreased significantly before important data, which does not give signals for entering the market. A break in the lower border of the indicator in the area of 1.1320 may increase pressure on the euro.
Description of indicators
- Moving average (moving average determines the current trend by smoothing out volatility and noise). Period 50. The graph is marked in yellow.
- Moving average (moving average determines the current trend by smoothing out volatility and noise). Period 30. The graph is marked in green.
- MACD indicator (Moving Average Convergence / Divergence - moving average convergence / divergence) Fast EMA period 12. Slow EMA period 26. SMA period 9
- Bollinger Bands (Bollinger Bands). Period 20