
Gold price broke above the 4 hour Ichimoku cloud and the downward sloping trend line. It is imperative that bulls are strong at current levels and push price higher. A bounce off this support area around $1,700 would be a bullish sign.
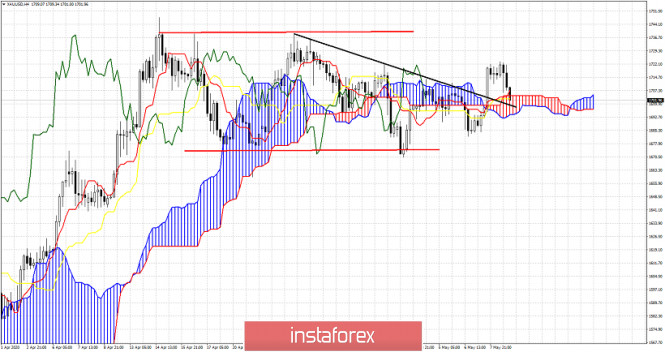
Black line -resistance trend line
Gold price remains inside the trading range. Price has broken above the black downward sloping trend line and above the 4hour Ichimoku cloud. These two signs are bullish. However price need to stay above the cloud and the trend line in order to confirm these bullish signals. This back test is normal and common to be seen after break out. A bounce off cloud support would increase the chances of the bullish scenario for a move to $1,740 and higher. Do not forget that price remains inside the trading range we have noted several days ago. As long as we stay inside the range, we are going nowhere.
The material has been provided by InstaForex Company - www.instaforex.com