
To open long positions on GBP/USD, you need:
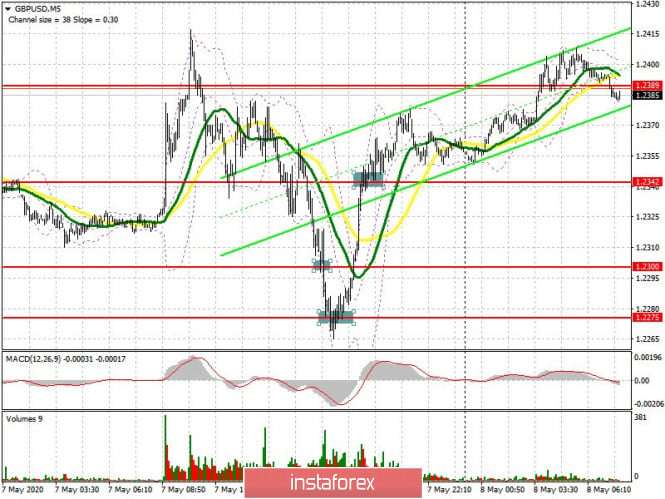
To get started, let's look at the deals that were on the British pound yesterday afternoon. I paid attention to the probability of a breakout 1.2342 and recommended selling from there. We see how buyers tried to stop the pound from falling near the 1.2300 level, which led to a slight upward rebound, but a second test led to a breakout, which pushed the pound to a larger support of 1.2275, from which I recommended opening long positions immediately for a rebound yesterday, which brought about 100 points of profit within the day. Consolidation at 1.2342 in the middle of the US session was also an additional signal to buy. Currently, buyers of the pound are focused on resistance 1.2411, on which the further growth of the pair depends. Consolidating in this range in the afternoon will be a signal to open new long positions in the expectation of continued correction of GBP/USD in the area of highs 1.2446 and 1.2478, where I recommend taking profits. In case the pound falls in the morning, it is best to return to long positions only after forming a false breakout in the support area of 1.2353, where the moving averages also goes, but I recommend buying the pair immediately for a rebound only from a low of 1.2305, counting on a correction of 30 -35 points inside the day.
To open short positions on GBP/USD you need:
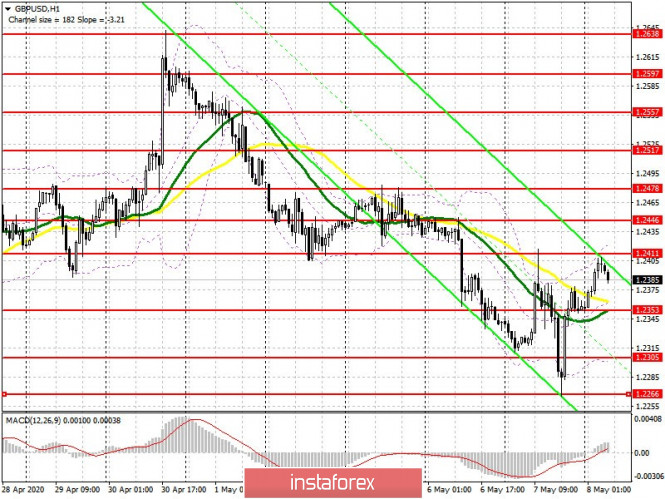
Important fundamental data on the US labor market will be released today, however, its impact on the pair will be insignificant, as the current reduction in the number of people employed in the United States by more than 20 million has already been taken into account. Pound sellers need to protect the resistance of 1.2411, where forming a false breakout will be a direct signal to open short positions while expecting GBP/USD to fall to a low of 1.2353. Consolidation below this level will certainly lead to the demolition of a number of stop orders of buyers and the pound's sharp fall to areas 1.2305 and 1.2266, where I recommend taking profits. In the absence of seller activity in the resistance area of 1.2411, it is best to postpone short positions until larger highs are updated in the areas of 1.2446 and 1.2478, from where you can sell immediately for a rebound in the expectation of a decrease in the pair by 20-30 points by the end of the day.
Signals of indicators:
Moving averages
Trading is conducted above 30 and 50 moving average, which indicates the likelihood of further forming an upward correction.
Note: The period and prices of moving averages are considered by the author on the hourly chart H1 and differs from the general definition of the classic daily moving averages on the daily chart D1.
Bollinger bands
A break of the upper border of the indicator in the region of 1.2425 will lead to a new bullish momentum. If the pair decreases, you can buy after testing the average border of the indicator in the region of 1.2353 or from its lower border in the region of 1.2305.
Description of indicators
- Moving average (moving average determines the current trend by smoothing out volatility and noise). Period 50. The graph is marked in yellow.
- Moving average (moving average determines the current trend by smoothing out volatility and noise). Period 30. The graph is marked in green.
- MACD indicator (Moving Average Convergence / Divergence - Moving Average Convergence / Divergence). Fast EMA period 12. Slow EMA period 26. SMA period 9.
- Bollinger Bands (Bollinger Bands). Period 20.