
Trend analysis (Fig. 1).
On Friday, the market from the level of 1.0931 (yesterday's closing of the daily candlestick) can continue to move up with the target of 1.0958 - a pullback level of 50.0% (red dashed line). If this level is broken up, the upward trend will continue with the target of 1.1003 - a pullback level of 61.8% (red dashed line).
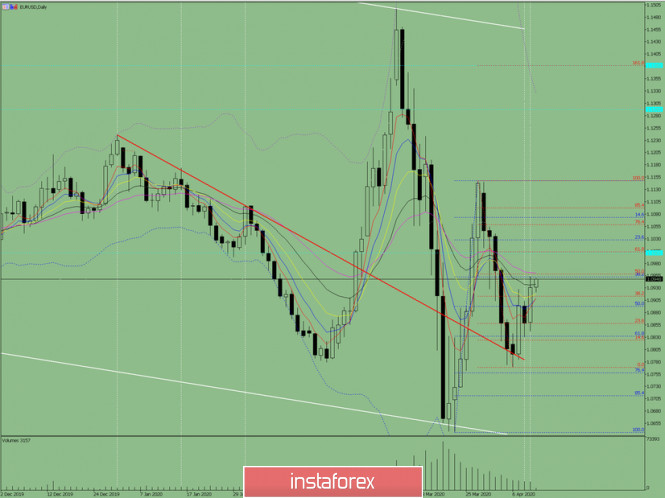
Fig. 1 (daily chart).
Comprehensive analysis:
- indicator analysis - up;
- Fibonacci levels - up;
- volumes - up;
- candlestick analysis - neutral;
- trend analysis - up;
- Bollinger lines - down;
- weekly schedule - up.
General conclusion:
Today, the price will try to continue to move up with the target of 1.1003 - a pullback level of 61.8% (red dashed line).
An unlikely scenario: working down from a pullback level of 50.0% - 1.0958 (red dashed line), with a target of 1.0893 - a pullback level of 50.0% (blue dashed line).
The material has been provided by InstaForex Company - www.instaforex.com