Crypto Industry News:
The Bitcoin hash rate has just dived sharply and is now falling by almost 45% compared to its peak in 2020. According to the hash rate, the network has dropped from 136.2 quintillion hash / s (EH / s) on March 1 to 75.7 EH / s for today.
Hash rate cryptocurrency is a parameter that indicates the number of calculations that a given network can perform every second. A higher hash rate means more competition among miners in the validation of new blocks; it also increases the number of resources needed to conduct a 51% attack, increasing network security.
After an unstable month in which Bitcoin recorded dramatic, but short-lived losses of up to 60% to around $ 3,600 in mid-March, network difficulty yesterday dropped by almost 16%.
The difficulty - or how difficult it is to calculate and check a block in the Blockchain chain - is adapted every 2016 blocks or two weeks to maintain a consistent ~ 10-minute block verification time.
This is closely related to the hash rate of the network. Typically, when the network experiences a low level of participating mining capacity, the difficulty decreases - while during periods of intense network participation it increases, acting as a balancing mechanism.
The last correction of difficulty took place on February 25 this year, when the Bitcoin price was around $ 9,900. Just three days later, it fell to around $ 8,800, and by March 14 to almost $ 4,800 - and on some exchanges up to $ 3,600, as mentioned above.
Technical Market Outlook:
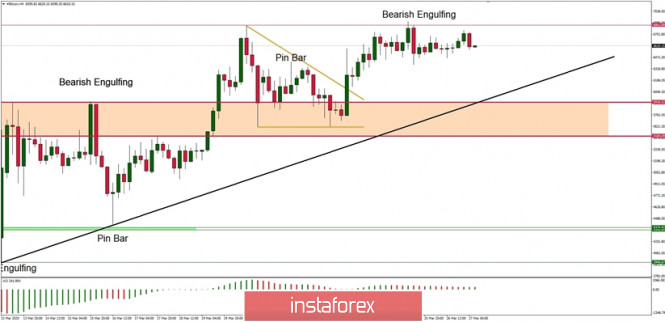
The bulls has pushed the price out of the Triangle formation and almost make the test of the technical resistance located at the level of $6,863, but the BTC/USD pair has reversed from the level of $6,863 after the Bearish Engulfing pattern was made. The market still consolidates the recent gains in a narrow range, however, bulls still make pressure on the market, but in the meantime they must be careful not the fall under the level of $5,500. Any violation of this level will likely lead to another wave down towards the nearest technical support seen at the level of $4,972. The key short-term technical support is seen at the level of $3,946 (13th March sell-off low). Please notice, that any breakout through the black trend line support will accelerate the wave down.
Weekly Pivot Points:
WR3 - $9,603
WR2 - $8,246
WR1 - $7,228
Weekly Pivot - $5,818
WS1 - $4,764
WS2 - $3,330
WS3 - $2,301
Trading Recommendations:
All the Elliott Wave based impulsive wave scenarios have been invalidated due to the important levels violation. The fear of the coronavirus consequences is too strong to traders and it rules on the financial markets, so it is better to stay away from the trading platform until the dust settles. Trade safe.