
Trend analysis:
In February, an upward movement is possible, with the first goal, 1.1273 - a pullback level of 23.6% (red dashed line). In case of breaking through this level, the next target 1.1518 is a pullback level of 38.2% (red dashed line).
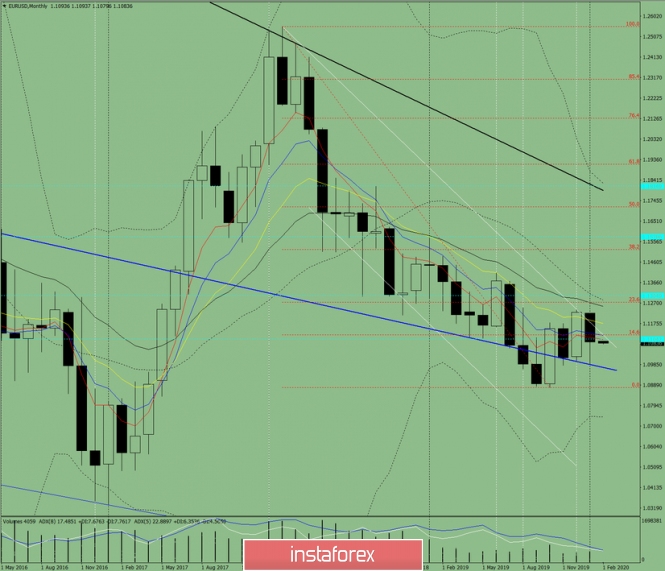
Fig. 1 (monthly chart).
Indicator Analysis:
- indicator analysis - up;
- Fibonacci levels - up;
- volumes - up;
- candlestick analysis - up;
- trend analysis - up;
- Bollinger lines - down;
The conclusion of a comprehensive analysis is most likely working at the top.
The total result of calculating the candle of the EUR / USD currency pair according to the monthly chart: the price will most likely have an upward trend with the absence of the first lower shadow (the first week of the month is white) and the absence of the second upper shadow (the last week is white).
The lower scenario is unlikely. However, the first lower target of 1.0967 which is the support line (blue bold line) will be considered.
The material has been provided by InstaForex Company - www.instaforex.com