
EUR/USD
Analysis:
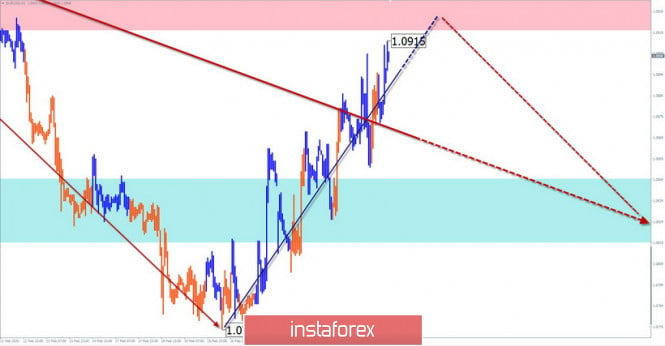
In the last six months, a downward wave zigzag has been formed on the chart of the European currency. Its last part (C) started in early January. The price has approached the upper limit of the preliminary completion zone. Before the final pull down, a counter rollback is formed.
Forecast:
Today's upcoming trading sessions are expected to see the end of the upward pullback, the formation of a reversal, and a price decline. The beginning of the downward phase can be expected by the end of the day or tomorrow.
Potential reversal zones
Resistance:
- 1.0920/1.0950
Support:
- 1.0850/1.0820
Recommendations:
Trading transactions against the trend direction may be unprofitable and not recommended. In the area of the calculated resistance zone, it is proposed to track euro sell signals.
AUD/USD
Analysis:
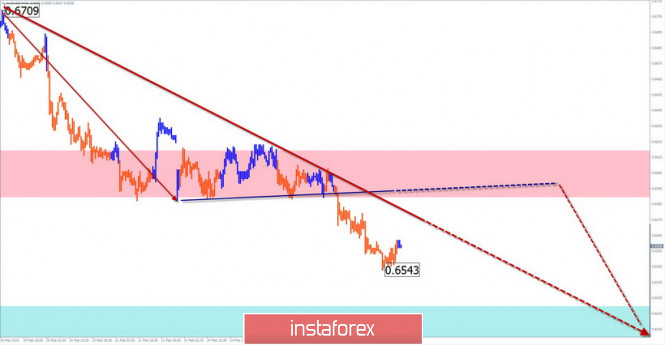
The downward trend continues on the Australian dollar chart. Its last section counts from the beginning of the current year. Last week, the price pushed down the level of intermediate support.
Forecast:
Before continuing the decline, the pair needs to gain a higher wave level, having worked out a pullback up. In the first half of the day, an upward mood is expected today, not above the resistance zone. You can expect a change of course at the end of the day or tomorrow.
Potential reversal zones
Resistance:
- 0.6590/0.6620
Support:
- 0.6520/0.6490
Recommendations:
Purchases on the "Aussie" market today are only possible within the intraday style with a reduced lot. We recommend that you focus on searching for sell signals in the area of calculated resistance.
GBP/JPY
Analysis:
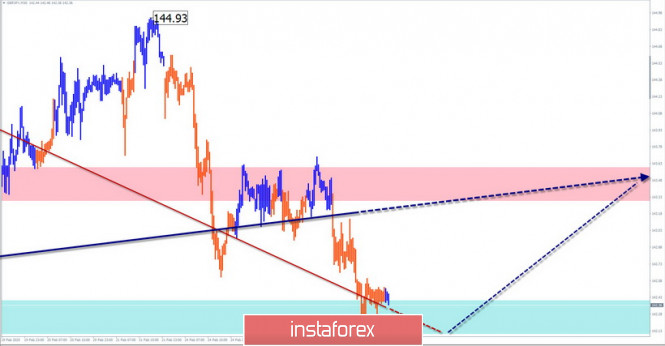
The last unfinished wave model on the pair's market started in mid-December last year. The middle part (B) is nearing completion. Analysis of the structure of this section shows that the wave is not complete.
Forecast:
In the coming day, you can expect the completion of the downward pullback of the last days, the formation of a reversal and the beginning of a price rise. The upcoming price growth may take a pronounced impulse character. The resistance zone shows the upper limit of the expected volatility.
Potential reversal zones
Resistance:
- 143.30/143.60
Support:
- 142.40/142.10
Recommendations:
Sales of the pair today can be very risky and not recommended. It is suggested to track the instrument purchase signals.
Explanations: In the simplified wave analysis (UVA), waves consist of 3 parts (A-B-C). The last incomplete wave is analyzed. The solid background of the arrows shows the formed structure and the dotted background shows the expected movements.
Note: The wave algorithm does not take into account the duration of the tool's movements in time!
The material has been provided by InstaForex Company - www.instaforex.com