
4-hour timeframe
Amplitude of the last 5 days (high-low): 106p - 114p - 79p - 80p - 74p.
Average volatility over the past 5 days: 91p (average).
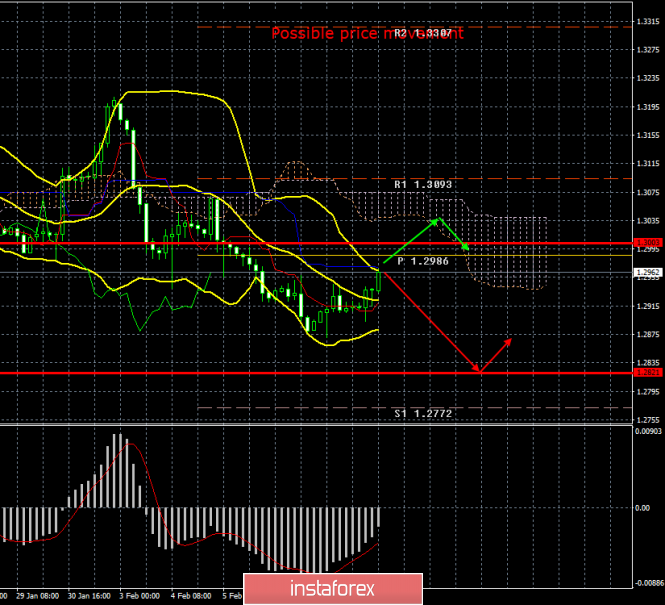
Tuesday, February 11, was supposed to be crucial for the British pound. Firstly, several important macroeconomic reports from the UK were planned for this day, and secondly, no data from the UK of an economic nature will be received by the end of the week. It should be noted that the pound has not resumed falling today, as many expected, but it has not risen too much either. By and large, the upward correction just continued and the price currently worked out the Kijun-sen line, from which it can rebound and resume moving down. Thus, in fact, no particularly strong reaction of traders to extremely important macroeconomic information has been followed today. Now the pound/dollar pair will try to overcome the critical line, and only in the event of a successful attempt to overcome the bulls can we expect the British currency to continue strengthening.
The most significant publication of today, of course, was the publication of the Gross Domestic Product. Moreover, four variations of this indicator were published immediately. For example, the first indicator of GDP (monthly change) was +0.3% in December with a forecast of +0.2%. The NIESR growth rate estimate has not yet been published at the moment, and the other two indicators, in quarterly and annual terms, bearing preliminary values for the fourth quarter, can be called more optimistic than expected. In annual terms, GDP growth amounted to +1.1% against the forecast of +0.8%. It is small, but better than it could be. In quarterly terms, the increase was 0% with a similar forecast. Thus, in general, we can say that the values were higher than the forecasts of experts, but, in fact, they do not really change the picture of things. Firstly, the GDP indicator has not changed compared to the previous period, an increase of +1.1% was also recorded in the third quarter. Secondly, the absence of another fall is not a positive factor. Thus, today's strengthening of the pound can really be considered just a continuation of the correction. But the second indicator, no less significant than the first, industrial production for December showed a decrease of 1.8% y/y with forecasts of -0.8% y/y, and in monthly terms - an increase of +0.1% in the forecast + 0.3%. Thus, this figure was much worse than expectations of traders, but did not cause new sales of the British currency. You can also note a more secondary indicator such as production in the manufacturing industry, which fell in December by 2.5% instead of the expected fall of 1%. In general, despite a more or less positive GDP, we believe that the next package of macroeconomic information from Britain turned out to be weak. Thus, we expect the pound/dollar pair to resume falling, especially if today quotes rebound from the critical line Kijun-sen.
It is also worth noting that perhaps a slight strengthening of the pound was provoked by Jerome Powell's speech. However, as we mentioned in the EUR/USD review, Powell did not disclose anything to the markets. His rhetoric was fully predictable and expected by traders. Today, a statement by the Chairman of the Bank of England Mark Carney in the Parliament of Great Britain is still planned. This statement could potentially be even more interesting than the statements made by Powell and Lagarde together, since the huge amount of speculation that went around the last meeting of the regulator ended with the BA leaving the key rate unchanged, and the number of members of the monetary committee who voted "for" it to decline not changed. Today, Mark Carney, who mentioned the recovery of Great Britain's economy last month, may make more resonant statements with respect to those that we heard at the end of January. Any hints of the need to soften monetary policy, the growing risks for the economy may result in new sales of the British currency. Although without such hints, it is clear that all the prospects for the British economy are now reduced to new reductions and decelerations.
From a technical point of view, corrective movement continues, and the further direction of movement will depend on overcoming or not overcoming the Kijun-sen line. Thus, traders are now advised to carefully monitor the behavior of prices near this line, remembering that the "dead cross" remains relevant.
Trading recommendations:
GBP/USD continues to adjust against the dead cross. Thus, selling the British pound with the target support level of 1.2772 is still relevant, but after the completion of the current correction, which can be determined by the rebound from the Kijun-sen line or by turning the MACD indicator down. Purchases of a pair by small lots can be considered if the price overcomes the Kijun-sen line with the first goal of the Senkou Span B. line
Explanation of the illustration:
Ichimoku indicator:
Tenkan-sen is the red line.
Kijun-sen is the blue line.
Senkou Span A - light brown dotted line.
Senkou Span B - light purple dashed line.
Chikou Span - green line.
Bollinger Bands Indicator:
3 yellow lines.
MACD indicator:
Red line and bar graph with white bars in the indicators window.
Support / Resistance Classic Levels:
Red and gray dashed lines with price symbols.
Pivot Level:
Yellow solid line.
Volatility Support / Resistance Levels:
Gray dotted lines without price designations.
Possible price movements:
Red and green arrows.
The material has been provided by InstaForex Company - www.instaforex.com