
4 hour time-frame
Amplitude of the last 5 days (high-low): 58p - 31p - 54p - 50p - 43p.
Average volatility over the past 5 days: 48p (average).
The EUR/USD currency pair completed the next trading week, and this week has become one of the most disastrous for the European currency in recent times. Throughout the entire week, traders got rid of the Euro currency. There was not a single correction or rollback and the total loss of the European Union currency amounted to 150 points. Perhaps, this is not very much at first glance, but we want to remind you that the euro has lost 550 points over the past 15 months, with the continuous downward trend. Therefore, 150 points of losses per week is still not a little. As for the reasons for the decline of the Euro, they generally remain the same. The European economy still looks much weaker than the US, the Fed's monetary policy is much stronger and more hawkish than the European one, and macroeconomic reports continue to come stronger from overseas than from the EU. That's all the reasons. Nevertheless, there were certain hopes for the growth of the euro, thanks to the "paradoxical situation", which saved the euro from new falls and collapses more than once, but this week, traders, in particular bears, sold the euro currency no matter what. The week ends at 62 points from two-year lows of the euro / dollar pair.
On the last trading day of the week, quite several important macroeconomic reports were published. It all began, as usual, with Europe, and more precisely with Germany. Industrial production in the locomotive country of the entire European Union decreased by 6.8% in annual terms and by 3.5% in monthly terms. But a month ago, we believed that a decrease of 2.5% y / y is a lot and much worse. It turns out that there is room for this indicator to decline, and December is a confirmation of this. Actually, it was already possible to clearly realize on this report that the euro had no special prospects on Friday, February 7. If production in Germany is reduced, it means that it will decrease in the European Union with a high degree of probability. And many other indicators, such as, for example, GDP and economic growth, now depend on production. Thus, we can expect further deterioration from the next reports from the Eurozone, which is unlikely to add optimism to buyers of the Euro currency.
However, more important macroeconomic data were expected from overseas. The first report (formally the first, since they were all published at the same time) turned out to be weak. The unemployment rate in January unexpectedly increased from 3.5% to 3.6%; however, this is not an indicator that can cause serious movements in the market. Moreover, the value of 3.6% is still an extremely low value for America, so this report is "weak" only formally. But the next report - NonFarm Payrolls showed a significant excess of the forecasted values (163,000) and amounted to as much as 225,000. It is clear that after such strong data on the state of the labor market (we add here the report from ADP on the change in the number of employees in the private sector), traders had no choice but to continue buying American currency.
This is all that can be said on Friday's macroeconomic background. What else could happen to the euro on this day if the only report in the Eurozone failed miserably, and all the data from across the ocean turned out to be strong? Based on the general picture of things, we continue to lean towards the option in which the euro continues to slide towards price parity with the US dollar. In the past two years, we can say nothing else, except that the American economy looks much stronger than the European one. Yes, the US economy is also under pressure due to a slowdown in global growth rates, because of trade conflicts, and it can also respond to the "coronavirus" in the near future, which will reduce business activity in China, and therefore in many countries - partners of China. However, the European economy is slowing down in the same way and its rates are much lower than the US. Therefore, the euro can be adjusted in the long run and it can rebound to new areas of support. More so, it can even be in demand from time to time, but the general trend will remain downward. Accordingly, the trading strategy for the EUR / USD pair remains the same: working out all the sell signals.
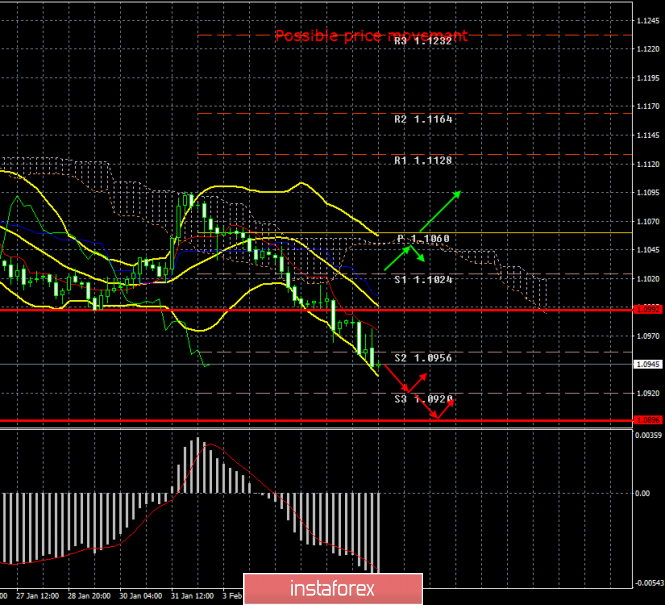
From a technical point of view, the pair overcame the second support level of 1.0956 this week, and on Monday, may finally begin to correct. However, we recommend waiting for a specific signal to identify the beginning of the correction. For example, the MACD indicator will turn up with a parallel price increase (the indicator is already at its minimum values and may just start to discharge).
Trading recommendations:
The EUR/USD pair continues to move down. Thus, it is recommended to remain in euro-currency sales with targets at levels 1.0920 and 1.0896, until the MACD indicator reverses or a rebound from any of the targets. It will be possible to consider the purchase of the euro / dollar pair with the goals of 1.1024 and 1.1060, if traders manage to gain a foothold above the Kijun-sen line, which is not expected in the near future.
Explanation of the illustration:
Ichimoku indicator:
Tenkan-sen is the red line.
Kijun-sen is the blue line.
Senkou Span A - light brown dotted line.
Senkou Span B - light purple dashed line.
Chikou Span - green line.
Bollinger Bands Indicator:
3 yellow lines.
MACD indicator:
Red line and bar graph with white bars in the indicators window.
Support / Resistance Classic Levels:
Red and gray dashed lines with price symbols.
Pivot Level:
Yellow solid line.
Volatility Support / Resistance Levels:
Gray dotted lines without price designations.
Possible price movements:
Red and green arrows.
The material has been provided by InstaForex Company - www.instaforex.com