
The last time we had a weekly RSI bearish divergence in Gold price, we saw prices pull back around $200. Gold price has formed a bearish reversal candlestick and combined with the RSI divergence makes us believe that we should expect more downside.
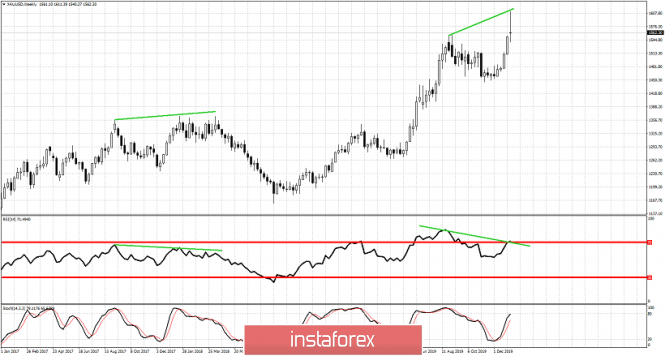
Green line- bearish divergence
Both the RSI and the stochastic are providing weekly bearish divergence warnings. The weekly candlestick with the long upper tails confirms this warning. Also in Elliott wave terms, Gold price we can say that it has made 5 waves up from the August of 2018 low. So it it is time for a pull back. Back in December of 2017 where we had a similar weekly bearish divergence, Gold price pulled back $200. We continue to expect such a pull to be very possible. First short-term target is the $1,500 area.
The material has been provided by InstaForex Company - www.instaforex.com