Crypto Industry News:
The average block time of the Blockchain Ethereum chain decreased by almost a quarter after reducing mining difficulties.
The data presented on the Etherscan block explorer show that from January 1 to January 4, the daily average block time of the chain decreased from 17.16 seconds to 12.96, which translates into a decrease of 24.48%.
Of course, the shorter time resulted in more blocks mined per day and higher ether inflation. According to the number of Ethereum blocks and the Etherscan reward table, on January 1, miners created 4980 new blocks and 10.237 ETH. Meanwhile, on January 4, network miners created 6,570 new blocks and 13,437 new ETHs. It is almost a 32% increase in the number of blocks and over 31% increase in block awards.
The changes described above are the consequences of the recent implementation of Muir Glacier's hard fork. This fork is to delay the so-called Ethereum Ice Age. The Ice Age protocol increases the difficulty of mining the network over time until it virtually prevents chain mining.
The ice age will occur through a series of difficulty bombs, which ultimately aims to prevent the further extraction of the old Ethereum chain after the implementation of the Ethereum 2.0 chain.
Technical Market Overview:
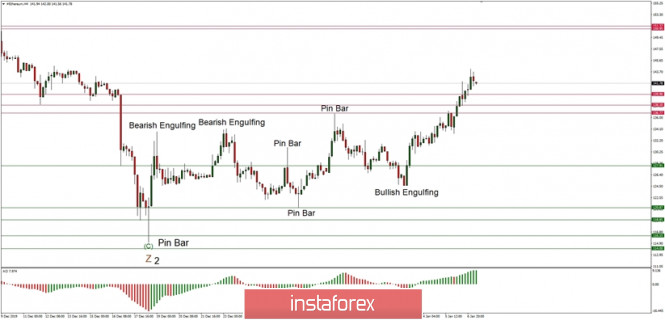
The ETH/USD pair has broken through the technical resistance located at the level of $139.90 and made a local high at the level of 4144.19. The momentum behind the move up looks strong, so there is still a chance to continue the rally towards the next target located at the level of $150.95. The nearest technical support is seen now at three levels: $139.90, $138.10 and $136.77. This move up might be the beginning of a new impulsive wave up since the corrective cycle had been terminated at the level of $116.15 in form of a Pin Bar candlestick pattern.
Weekly Pivot Points:
WR3 - $152.72
WR2 - $144.64
WR1 - $140.53
Weekly Pivot - $132.09
WS1 - $127.41
WS2 - $119.97
WS3 - $115.08
Trading Recommendations:
The best strategy in the current market conditions is to trade with the larger timeframe trend, which is down. All the shorter timeframe moves are still being treated as a counter-trend correction inside of the downtrend. When the wave 2 corrective cycles are completed, the market might will ready for another wave up.