MG Network

something big isHappening!

In the mean time you can connect with us with via:

Copyright © Money Grows Network | Theme By Gooyaabi Templates

Money Grows Network

Archive

Powered by Blogger.

Welcome To Money Grows Network

Verified By

2006 - 2019 © www.moneygrows.net

Investments in financial products are subject to market risk. Some financial products, such as currency exchange, are highly speculative and any investment should only be done with risk capital. Prices rise and fall and past performance is no assurance of future performance. This website is an information site only.

Popular

Pages

Expert In

Name*


Message*

EUR/USD IPDA 60 Days Premium-Discount Array For Jan 20, 2020

analytics5e251ac9e66ea.jpg

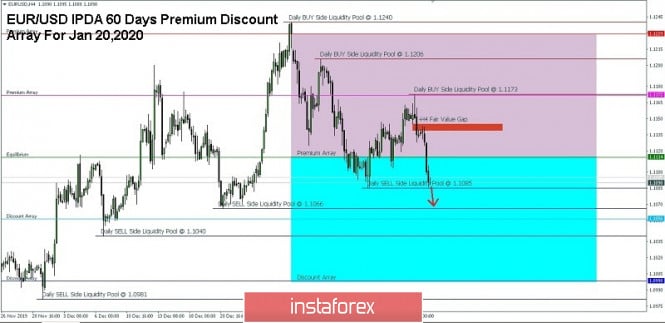
After testing the Fair Value Gap at 4, Hour Chart Fiber looks like moving in the Market Maker SELL Model in Low Resistance Liquidity Run condition. It seems this pair will try to attack the Daily Chart SELL Side Liquidity Pool @ 1.1066 but firstly this pair must be breakout and close bellow the 1.1085 and as long they do not break out and close above the Daily Chart BUY Side Liquidity Pool 1.1173 the EUR/USD still continue its down movement.

So the bias from EUR/USD base Interbank Price Delivery Algorithm (IPDA) 60 Days is bearish.

(Disclaimer)

The material has been provided by InstaForex Company - www.instaforex.com