
4-hour timeframe
Technical data:
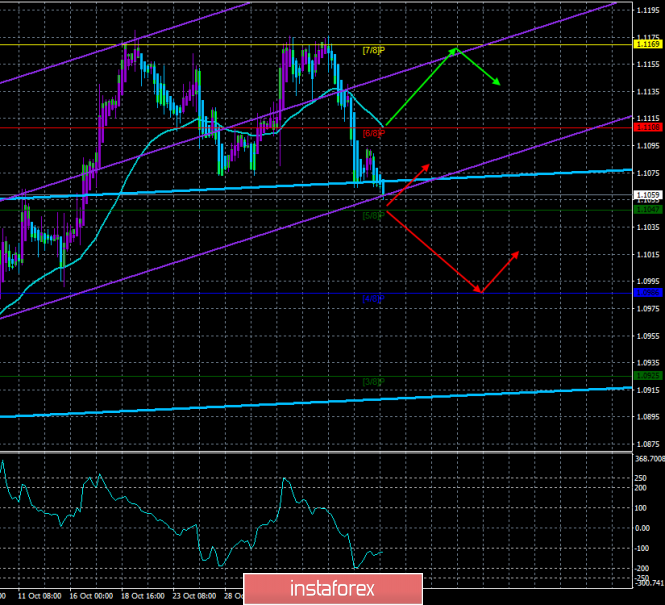
The upper channel of linear regression: direction – sideways.
The lower channel of linear regression: direction – upward.
The moving average (20; smoothed) – down.
CCI: -123.6285
The third trading day of the week ended for the EUR/USD pair again with a decline, albeit a small one. As we mentioned earlier, the pair with a high degree of probability switched to the formation of a new downward trend, so we expect a continued downward movement in almost any case. The macroeconomic statistics of the past day were reduced to the indices of business activity (in the service sector and composite) in the European Union and some countries of the eurozone. Surprisingly, the most significant indices of business activity, in Germany and the EU, exceeded their forecast values. Moreover, none of the indices in the service sector slipped below the key level of 50.0. Thus, business activity in the services sector of the EU countries remains afloat, which cannot but rejoice. It cannot but please anyone, but not traders who simply ignored this information. Yes, business activity indices are not the most significant indicators, however, they could be counted on as a help.
Thus, at the moment, the scenario that we described a few days ago is coming true – the formation of a downward trend based on the general negative for the euro fundamental background and technical signals (three rebounds from the Murray level of "7/8"). On Thursday, November 7, a change in industrial production for September will be published in Germany (a decrease of 2.9% y/y is expected), in the States – the number of applications for unemployment benefits, and all the attention of traders will be focused on the UK and the British pound, as today will be a meeting of the Bank of England, summing up its results and the speech of the head of the regulator Mark Carney. As you can see, today there will be little macroeconomic data for the euro/dollar pair and all of them will be, as often happens in recent years, interesting, but insignificant. What, for example, will the next reduction in industrial production in Germany say? The fact that the index of business activity in the manufacturing sector perfectly warns traders of the decline in this area. The fact that the largest economy of the European Union, its locomotive, is experiencing serious problems, despite the budget surplus, despite the falling inflation. The fact that optimistic information can also not be expected from industrial production in the whole eurozone. But the reaction to such an indicator as industrial production in Germany is unlikely to follow from traders.
What is the result? As a result, we believe that the euro will continue its downward movement. In the coming weeks, it may fall again to the lows for two years. The problem is that all the economic problems of the European Union remain. The problem is that if Trump starts a trade war with the European Union (and there are such plans), it will mean an even greater decline in all indicators in the EU. The problem is that the deposit rate is already negative in the EU, and the loan rate – zero. The problem is that the quantitative easing program has started to work again, and the effect from it is still zero. The problem is that the United States also have their problems, but the US government and the Fed are coping with them, and the negative effects are not visible as in the European Union. If Trump does manage to sign a trade agreement with China, it will mean a potential increase in economic indicators in both the US and China. But we are more interested in the States and their impact on the EUR/USD currency pair. And the impact will be simple: economic statistics will begin to improve again, which will cause new purchases of the US currency and, accordingly, its growth in the world currency markets. And the Fed will stop easing monetary policy, as this will not be necessary. For the euro, all hopes of growth still lie overseas. The first is that America should be in a state of a trade war with China as long as possible, and at the same time not start a similar war with the EU. The second is for the Fed to continue to cut the key rate, as Donald Trump wants it.
From a technical point of view, the Heiken Ashi indicator continues to color the bars blue, which signals an intraday downward movement. Thus, the trend for the pair is now downward, therefore, trading should be lower.
Nearest support levels:
S1 – 1.1047
S2 – 1.0986
S3 – 1.0925
Nearest resistance levels:
R1 – 1.1108
R2 – 1.1169
R3 – 1.1230
Trading recommendations:
The euro/dollar pair overcame the moving, overcame the Murray level of "6/8". Thus, it is now recommended to sell the euro currency with the nearest target of 1.1047. If it is overcome, it will be possible to buy the dollar with the target of 1.0986. It is not recommended to return to the pair's purchases now, there are no fundamental or technical reasons for this.
In addition to the technical picture, fundamental data and the time of their release should also be taken into account.
Explanation of the illustrations:
The upper channel of linear regression – the blue line of the unidirectional movement.
The lower channel of linear regression – the purple line of the unidirectional movement.
CCI – the blue line in the indicator window.
The moving average (20; smoothed) – the blue line on the price chart.
Support and resistance – red horizontal lines.
Heiken Ashi – an indicator that colors bars in blue or purple.
Possible variants of the price movement:
Red and green arrows.
The material has been provided by InstaForex Company - www.instaforex.com