
EUR/USD
Yesterday, the EUR/USD pair reacted most strongly to the release of data on home sales in the US secondary real estate market. In the October estimate, the indicator increased from 5.36 million y/y to 5.46 million y/y. From the top of the day to a low, the pair passed 40 points, which is slightly higher than the usual volatility on similar news. Apparently, the markets have begun to lay the difference in the rate of slowdown of the world economy and the US economy, which clearly feels better than the global economy. This conclusion can also be drawn from the comments of economic agencies that forecasts a slowdown in the Chinese and American economies during the course of the trade war — estimates in favor of the American one. Thus, economic statistics again come to the fore, and today the PMI indices for the eurozone and the US for the current month are published. European Manufacturing PMI is expected to grow from 45.9 to 46.4, while US Manufacturing PMI can grow from 51.3 to 51.5. European Services PMI is projected to grow from 52.2 to 52.4, American from 50.6 to 51.2. Here we see that the US manufacturing PMI is expected to be higher in absolute numbers, and the services sector is higher in strength of growth. As a result, the euro may continue to decline.
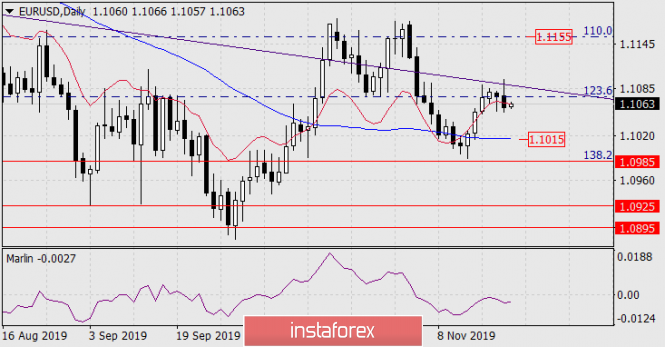
On the daily chart, the price worked out the embedded line of the large downward price channel and went under the balance indicator line - the market balance shifted downward. The Marlin oscillator continues to fall in the negative zone. The purpose of the movement is the MACD indicator line (1.1015).
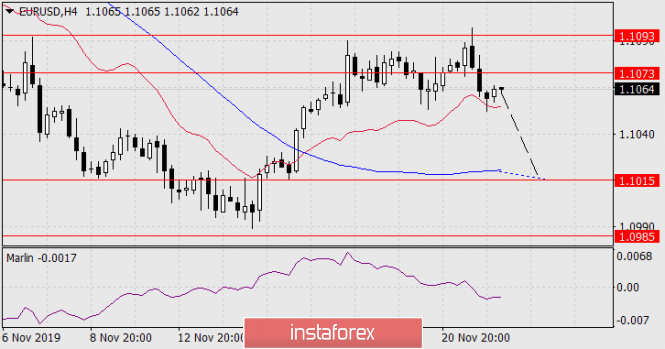
On a four-hour chart, the price lingered on the balance line, Marlin infiltrated the decline zone for the first time in eight days. Target level of 1.1015 on H4 also coincides with the MACD line - it will slightly fall when the price drops. Consolidation below the level will open the underlying target of 1.0985 - the Fibonacci reaction level is 138.2% on daily.
The material has been provided by InstaForex Company - www.instaforex.com