
4-hour timeframe
Amplitude of the last 5 days (high-low): 56p - 38p - 27p - 36p - 25p.
Average volatility over the past 5 days: 36p (low).
The fourth trading day of the week for the EUR/USD currency pair was again in the lowest volatility movement, and today it is not even possible to say that the downward trend has continued, since quotes have not dropped much during the day. It seems that the outbursts of the bears dried up, and we already wrote about the reasons for this in previous reviews. A paradoxical situation persists for the euro/dollar pair. By this term we mean a situation in which the bulls have no reason to buy the euro, and the bears do not have good reasons for further selling the pair near its 2-year lows. As a result, all this can lead to the exit of the market and the bears, the volatility will fall even more, and the pair will increase, starting an upward correction, which will not be substantiated either fundamentally or technically.
Traders again received a fairly large amount of important macroeconomic information during the day. This week is generally surprisingly plentiful for various kinds of macroeconomic statistics and just interesting news. However, that very paradoxical situation, unfortunately, blocks the development by traders of all this interesting information. For example, today German GDP by preliminary value showed an increase of 0.1% in quarterly terms, although experts expected a decrease of 0.1%. In annual terms, GDP grew by 0.5%, which, of course, is very small, but still more than a quarter earlier. Eurozone GDP also unexpectedly pleased, although this is also an inconclusive value indicator. The increase in the third quarter was + 0.2% QOQ and + 1.2% in annual terms (forecast + 1.1% YOY). Thus, certain grounds for strengthening the euro were received during the European trading session. However, the bulls continued to remain outside the market, considering that the preliminary values are not final and can still change for the worse. In general, market participants simply ignored data from Europe.
There was not a single important publication in the United States, but the euro/dollar pair began to grow during the US trading session, which so far can not be called either strong or even average in strength. Nevertheless, it takes place and can be the beginning of at least a correction of the pair.
One of the most interesting news of today is the announcement of Beijing's refusal from the annual purchase of US agricultural products for a fixed amount of $50 billion. China does not refuse the earlier promise to purchase pork, soybeans and other agricultural products from America, but does not consider it a profitable option to deal with a strictly prescribed amount. In addition, it is reported that Beijing is not going to take any action in the field of intellectual property protection, which Washington insists. Now the most important thing! What have we heard in recent weeks on the US-China trade war? "Progress in the negotiations", "the parties are close to an agreement in the first phase" and so on. What do we have in fact? China and the United States cannot agree again on several key points of the agreement. Moreover, at what points the parties reached an agreement, not reported. What do we have in the bottom line? Only that trade negotiations can be considered stalled once again. Donald Trump has already managed to cover this topic, saying in the Economic Club in New York that the US will significantly increase duties on Chinese products if agreements cannot be reached. That is, in fact, Donald Trump continues to adhere to the previously chosen strategy, which implies either the consent of China to the conditions of the United States, or an increase in duties on all imports from China. The American leader believes that it is China that can fail negotiations for the second time in a row, since the parties could have signed the agreement earlier, but Beijing refused to comply with "some of the agreements reached earlier." "We will only agree to a deal if it is beneficial to American workers and companies," Trump concluded. At the current stage of negotiations between Washington and Beijing, we can assume that the trade war will drag on for many years, and Donald Trump will not continue it in a year.
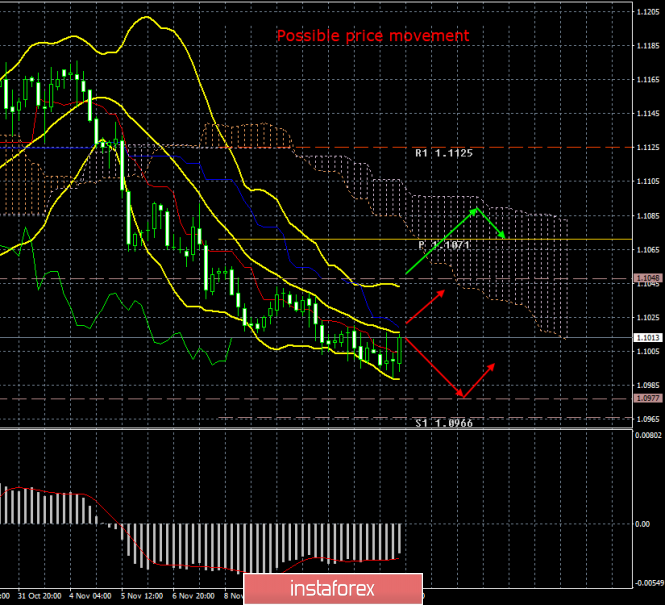
Well, the technical picture of the currency pair currently seems to be unambiguous, but at the same time implying non-standard options for the development of events. We have already said that from a fundamental point of view that the pair's fall is justified. But at the same time, the fundamental background is not so strong that traders continue to sell the pair near its 2-year lows. It is this factor that can play in the euro's favor in the coming days and weeks. We believe it is highly likely that an upward correction will begin today, despite the macroeconomic statistics that have already been published this week and will be published.
Trading recommendations:
The EUR/USD pair still retains the prospects for a downward trend. Thus, it is now recommended to continue to sell the currency pair with targets at 1.0977 and 1.0966. At the same time, overcoming the Kijun-sen critical line by traders will confirm our hypothesis that the trend direction will change to an upward one and sell positions will lose their relevance. New pair sales are now risky, purchases are not fundamentally substantiated.
Explanation of the illustration:
Ichimoku indicator:
Tenkan-sen is the red line.
Kijun-sen is the blue line.
Senkou Span A - light brown dotted line.
Senkou Span B - light purple dashed line.
Chikou Span - green line.
Bollinger Bands Indicator:
3 yellow lines.
MACD indicator:
Red line and bar graph with white bars in the indicator window.
Support / Resistance Classic Levels:
Red and gray dotted lines with price symbols.
Pivot Level:
Yellow solid line.
Volatility Support / Resistance Levels:
Gray dotted lines without price designations.
Possible price movements:
Red and green arrows.
The material has been provided by InstaForex Company - www.instaforex.com