Technical Market Overview:
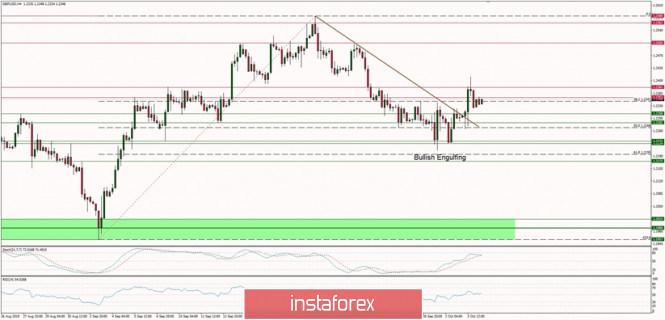
The GBP/USD pair has broken through the short-term trendline resistance around the level of 1.2308 and made a local high at the level of 1.2411. Nevertheless, at the end of the move up, there is a Shooting Star candlestick pattern, which is a trend reversal signal. The next target for bulls is seen at the level of 1.2504, but the traders should be very cautious now as the bears might try to regain control over the market again and puch the price back under the trendline again.
Weekly Pivot Points:
WR3 - 1.2628
WR2 - 1.2566
WR1 - 1.2402
Weekly Pivot - 1.2333
WS1 - 1.2163
WS2 - 1.2096
WS3 - 1.1935
Trading Recommendations:
The best strategy for current market conditions is to trade with the larger timeframe trend, which is down. All upward moves will be treated as local corrections in the downtrend. In order to reverse the trend from down to up, the key level for bulls is seen at 1.2505 and it must be clearly violated. The key short-term technical support is seen at the level of 1.2231 - 1.2224 and the key short-term technical resistance is located at the level of 1.2381. As long as the price is trading below this level, the downtrend continues towards the level of 1.1957 and below.