Crypto Industry News:
An interesting phenomenon has emerged over the past few months: Ethereum blockchain began to gain popularity, even when the ETH price dropped. At the same time, volume as well as overall network activity have improved considerably. In addition, transaction fees at Ethereum recorded a decrease of about 50% compared to the maximum values recorded last week.
The attention of crypto enthusiasts was caught when the transaction fees paid by Ethereum users last month exceeded those of Bitcoin users. From September 22, the average ETH transfer cost between $ 0.045 to $ 0.064, while the Bitcoin confirmation fee was just $ 0.03.
Last week, Ethereum had to pay tens of cents on average. A huge number of transfers followed, and the cost of using the network increased significantly. The reason could be a FairWin scam, but it is now known that FairWin has fallen. Along with this, there was a significant decline in Ethereum network activity as well as a decrease in transaction fees: fees paid by Ethereum users dropped from 1627 ETH in the peak of last week to 500 ETH yesterday.
Technical Market Overview:
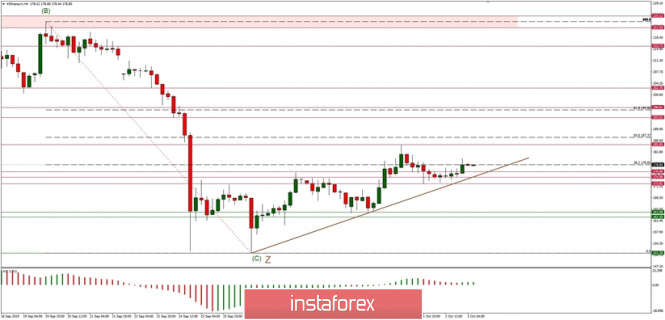
The ETH/USD pair has bounced from the technical support located at the level of $172.82 and still trades above the short-term trendline support. Nevertheless, the momentum is clearly decreasing and there is no new local high made yet, so the bears might counter-attack any time now. In the case of a spike down, the nearest technical support is located at the level of $163.98 - $162.50. Please notice, that so far the move upward does not look like an impulsive wave, but more like a kind of a Zig-Zag pattern, which is corrective pattern.
Weekly Pivot Points:
WR3 - $256.80
WR2 - $233.68
WR1 - $197.61
Weekly Pivot - $174.45
WS1 - $137.03
WS2 - $112.52
WS3 - $77.73
Trading Recommendations:
The best strategy in the current market conditions is to trade with the larger timeframe trend, which is still up. All the shorter timeframe moves are still being treated as a counter-trend correction inside of the uptrend. When the wave 2 corrective cycles are completed, the market might will ready for another impulsive wave up of a higher degree and uptrend continuation.