
Last week, the pair moved in the side channel. Moving down, the pair almost reached a strong pullback level of 61.8% - 1.2196 (blue dotted line), but there weren't enough bears for more, and the pair spent the rest of the week in the side channel. Most likely, an upward movement is possible this week.
Trend analysis.
This week, the price will move up with the first target 1.2412 - the upper fractal. In case of reaching this level, the continuation of the upward work.
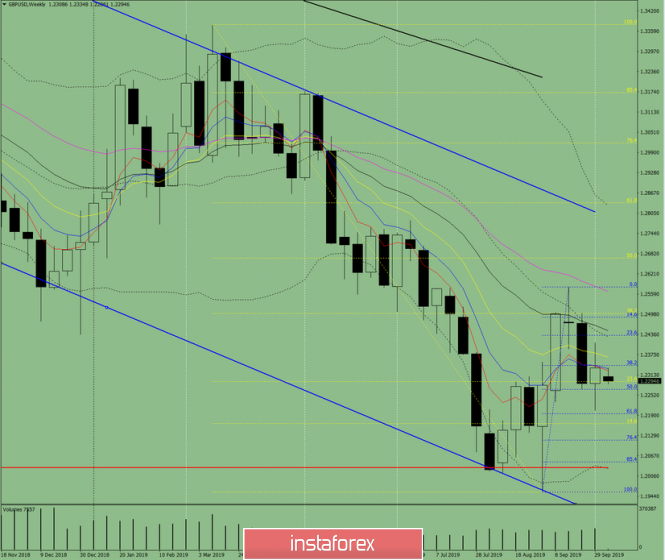
Fig. 1 (weekly schedule).
Comprehensive analysis:
- indicator analysis - up;
- Fibonacci levels - up;
- volumes - up;
- candlestick analysis - down;
- trend analysis - up;
- Bollinger Lines - down;
- monthly chart - up.
The conclusion of a comprehensive analysis is an upward movement.
The overall result of calculating the candle of the GBP / USD currency pair according to the weekly chart: the price of the week is likely to have an upward trend with the presence of the first lower shadow of the weekly white candlestick (Monday - down) and the absence of the second upper shadow (Friday - up).
The material has been provided by InstaForex Company - www.instaforex.com