
Gold price remains inside the short-term bearish channel that was created since price topped back in early September around $1,556. Since then price is making lower lows and lower highs and is vulnerable to a move lower towards $1,440-$1,400.
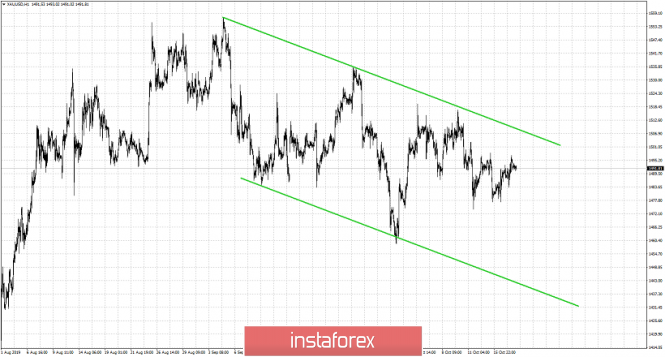
But what would make us change our bearish view? First bulls will need to break above this bearish channel and break above recent highs at $1,520. This would be a sign of strength that could cancel the bearish scenario. A break above $1,520, if real and not fake, should enough for bulls to be able to break above the $1,536 short-term top where price hits the upper channel boundary back in late September. Bears on the other hand want to see price eventually break below $1,490 and staying below it. This would be a sign of weakness. Our first downside target remains at $1,440 but there is always the probability of seeing lower levels like $1,400.
The material has been provided by InstaForex Company - www.instaforex.com