
Trend analysis (Fig. 1).
On Monday, the price will move down, with the first target at 1.2586 - a pullback level of 23.6% (red dashed line). If this level is reached, there will be a continuation of the lower movement to the pullback level of 38.2% - 1.2512 (red dashed line).
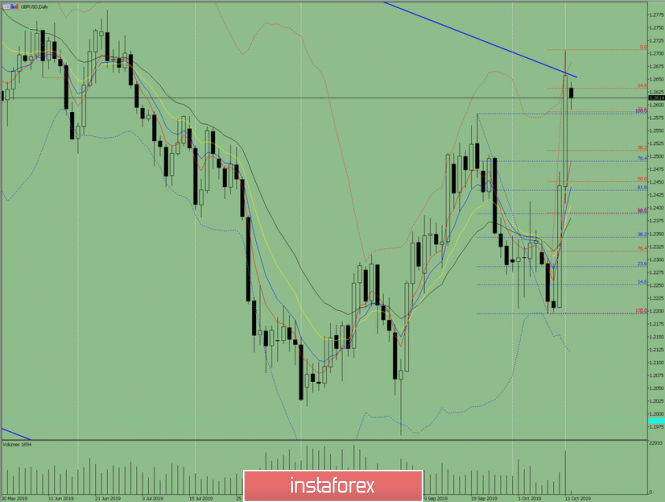
Fig. 1 (daily chart).
Comprehensive analysis:
- indicator analysis - down;
- Fibonacci levels - down;
- volumes - up;
- candlestick analysis - up;
- trend analysis - down;
- Bollinger Lines - up;
- weekly schedule - up.
General conclusion:
On Monday, the price may begin to roll back down.
The first intermediate lower target at 1.2586 is a pullback level of 23.6% (red dashed line).
In case of reaching the intermediate target, the continuation of the lower movement to the pullback level of 38.2% - 1.2512 (red dotted line) is possible.
An unlikely scenario is an upward movement with the target upper fractal - 1.2707 (red dashed line).
The material has been provided by InstaForex Company - www.instaforex.com