
Minuette (H4)
Here's a comprehensive analysis of the development options for the movement AUD / USD vs USD / CAD vs NZD / USD vs #USDX from October 25, 2019 on the Minuette operational scale forks (H4 time frame)
____________________
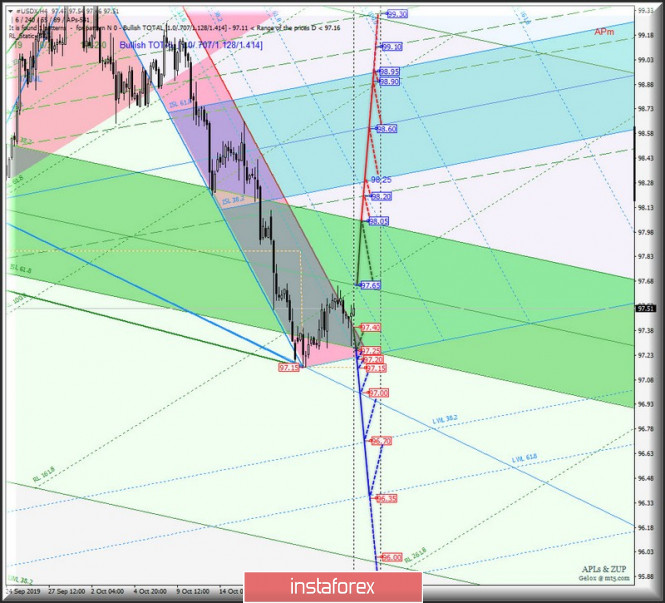
US dollar Index
The movement of the dollar index #USDX from October 25, 2019 will be due to the development and range breakdown direction :
- resistance level of 97.65 on the Median Line Minuette operational scale forks;
- support level of 97.40 on the boundary of the red zone of the Minuette operational scale forks.
Now, in case that the Median Line Minuette breaks down (resistance level of 97.65), the dollar index price may continue to rise towards the targets - the upper boundary of the ISL38.2 (98.05) equilibrium zone of the Minuette operational scale forks - the final Schiff Line Minuette (98.20) - the equilibrium zone (98.25 - 98.50 - 98.95) of the Minuette operational scale forks.
Consecutive breakdown of support levels :
- 97.40 (the boundary of the red zone of the Minuette operational scale forks);
- 97.25(lower boundary of the ISL61.8 equilibrium zone of the Minuette operational scale forks);
- 97.20 (start line SSL of the Minuette operational scale forks);
- 97.15 (local minimum);
will make the continuation of the downward movement of #USDX to the control LTL (97.00) and warning - LWL38.2 (96.70) - LWL61.8 (96.35) - to the lines of the Minuette operational scale forks relevant.
The markup of #USDX movement options from October 25, 2019 is shown in the animated chart.
____________________
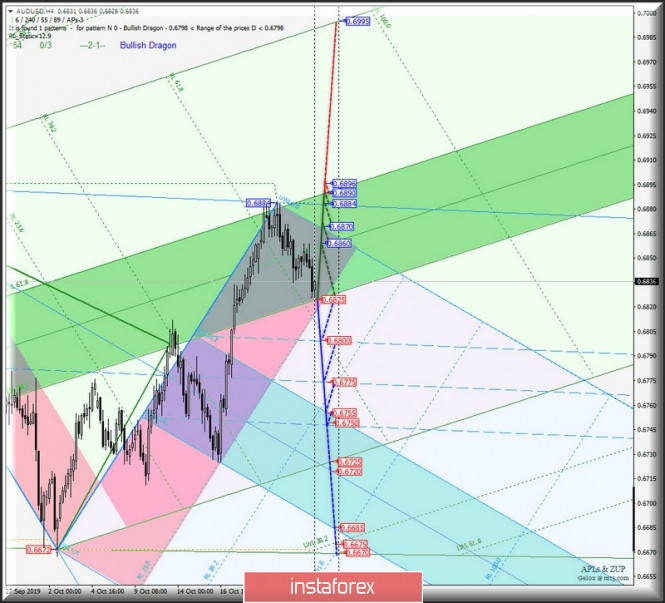
Australian dollar vs US dollar
The development of the movement of the Australian dollar AUD / USD on October 25, 2019 will depend on the development and direction of the breakdown of the boundaries of the equilibrium zone (0.6825 - 0.6860 - 0.6890) of the Minuette operational scale forks. The details of the development of the boundaries of this equilibrium zone are presented in the animated chart.
The breakdown of the lower boundary of ISL38.2 (support level of 0.6825) of the equilibrium zone of the Minuette operational scale forks - continuation of the development of the downward movement of the Australian dollar to the a Median Line channel (0.6800 - 0.6775 - 0.6750) and equilibrium zones (0.6755 - 0.6720 - 0.6685) of the Minuette operational scale forks.
In the case of combined breakdown of resistance levels :
- 0.6890 (the upper boundary of ISL61.8, the equilibrium zone of the Minuette operational scale forks);
- 0.6896 (local maximum);
The upward movement of AUD / USD can be continued to the final line FSL (0.6995) Minuette operational scale forks.
From October 25, 2019, we look at the layout of the AUD / USD movement options in the animated chart.
____________________
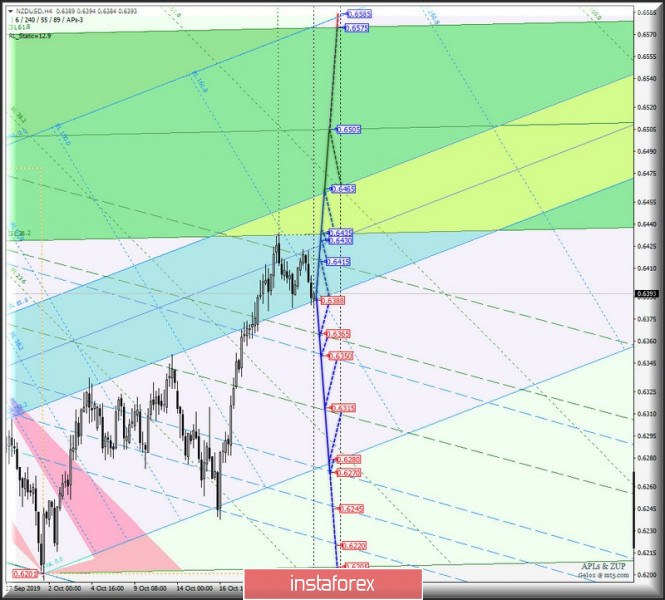
New Zealand dollar vs US dollar
From October 25, 2019, the development of the movement of the New Zealand dollar NZD / USD will be determined by the development and direction of the breakdown of the boundaries of the equilibrium zone (0.6388 - 0.6430 - 0.6465) of the Minuette operational scale forks. The marking of the development of the above levels is shown in the animated chart.
The breakdown of the lower boundary of ISL38.2 (support level of 0.6388) of the equilibrium zone of the Minuette operational scale forks - an option to continue the downward movement of the New Zealand dollar to the targets - 1/2 Median Line Minuette (0.6365) - the final Schiff Line Minuette (0.6350) - the lower boundary of the 1/2 Median Line Minuette channel (0.6315) - the initial SSL line (0.6280) Minuette operational scale forks.
On the contrary, if the upper boundary of ISL61.8 (resistance level of 0.6465) is broken, the equilibrium zone of the Minuette operational scale forks will confirm that further the development of the NZD / USD movement which will occur within the boundaries of the equilibrium zone (0.6435 - 0.6505 - 0.6575) of the Minuette operational scale forks.
The marking options NZD / USD from October 25, 2019 can be seen in the animated chart.
____________________
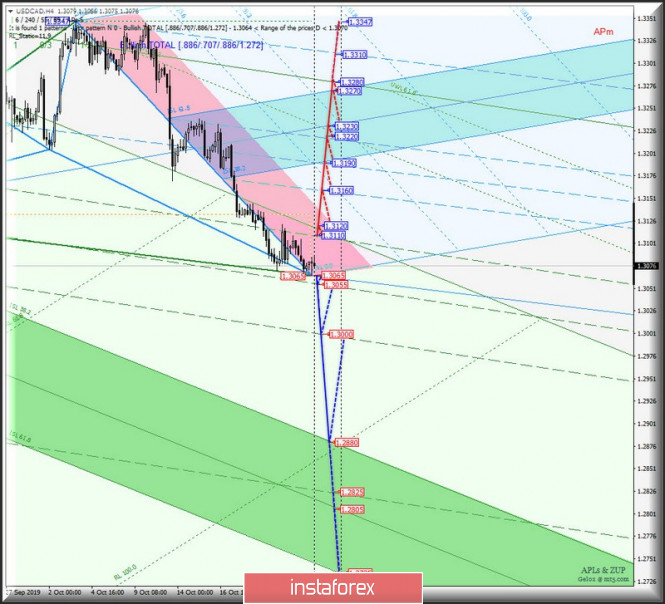
US dollar vs Canadian dollar
The development of the movement of the Canadian dollar USD / CAD from October 25, 2019 will be due to the development and direction of the breakdown of the range:
- resistance level of 1.3110 (upper boundary of the 1/2 Median Line channel of the Minuette);
- support level of 1.3065 - local minimum (control line LTL Minuette operational scale forks).
Consecutive breakdown of support levels :
- 1.3065 (control line LTL Minuette operating scale forks);
- 1.3055 (1/2 Median Line Minuette);
will determine the continuation of the downward movement of the Canadian dollar to the lower boundary of the 1/2 Median Line Minuette channel (1.3000) and the upper boundary of ISL38.2 (1.2880) the equilibrium zone of the Minuette operational scale forks.
In case of combined breakdown, the resistance level is :
- 1.3110 (the upper boundary of the 1/2 Median Line Minuette channel);
- 1.3120 (start line SSL of the Minuette operational scale forks);
the upward movement of USD / CAD can continue to the boundaries of the 1/2 Median Line channel (1.3160 - 1.3190 - 1.3220) and the equilibrium zone (1.3190 - 1.3230 - 1.3270) of the Minuette operating scale forks.
From October 25, 2019, we look at the layout of the USD / CAD movement options in the animated chart.
____________________
The review is made without taking into account the news background. Thus, the opening of trading sessions of major financial centers does not serve as a guide to action (placing orders "sell" or "buy").
The formula for calculating the dollar index:
USDX = 50.14348112 * USDEUR0.576 * USDJPY0.136 * USDGBP0.119 * USDCAD0.091 * USDSEK0.042 * USDCHF0.036.
where the power coefficients correspond to the weights of the currencies in the basket:
Euro - 57.6%;
Yen - 13.6%;
Pound Sterling - 11.9%;
Canadian dollar - 9.1%;
Swedish Krona - 4.2%;
Swiss franc - 3.6%.
The first coefficient in the formula leads the index to 100 at the start date of the countdown - March 1973, when the main currencies began to be freely quoted relative to each other.
The material has been provided by InstaForex Company - www.instaforex.com