
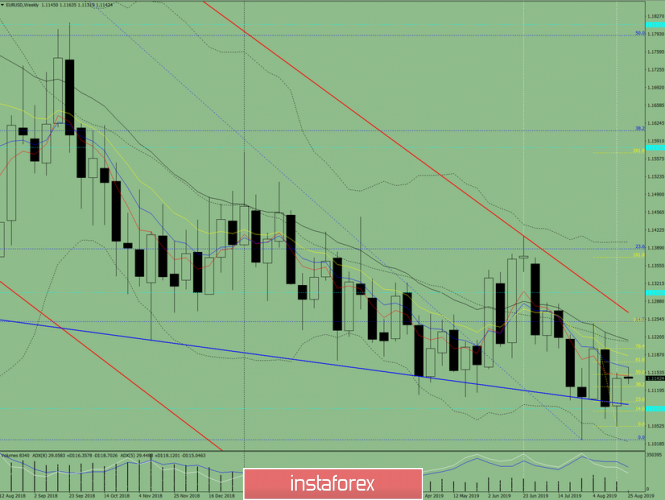
Last week, the pair made an upward movement, breaking off the support line of 1.1095 (blue bold line). The price tested a pullback level of 50% - 1.1150 (yellow dotted line). This week, there is a high probability of continuing the upward movement.
Trend analysis.
This week, the price will move up with the first target of 1.1173 – a retracement level of 61.8% (yellow dotted line), when it reaches further a retracement level of 76.4% - 1.1199 (yellow dotted line).
Fig. 1 (weekly chart).
Comprehensive analysis:
- Indicator analysis – down;
- Fibonacci levels – up;
- Volume – up;
- Candlestick analysis – up;
- Trend analysis – up;
- Bollinger Bands – down;
- Monthly chart – up.
The conclusion of the comprehensive analysis is an upward movement.
The overall result of calculating the candle of the EUR / USD currency pair according to the weekly chart: the price of the week is likely to have an upward trend with the absence of the first lower shadow of the weekly white candlestick (Monday – up) and the lack of the second upper shadow (Friday – up).
The material has been provided by InstaForex Company - www.instaforex.com