
To open long positions on EURUSD you need:
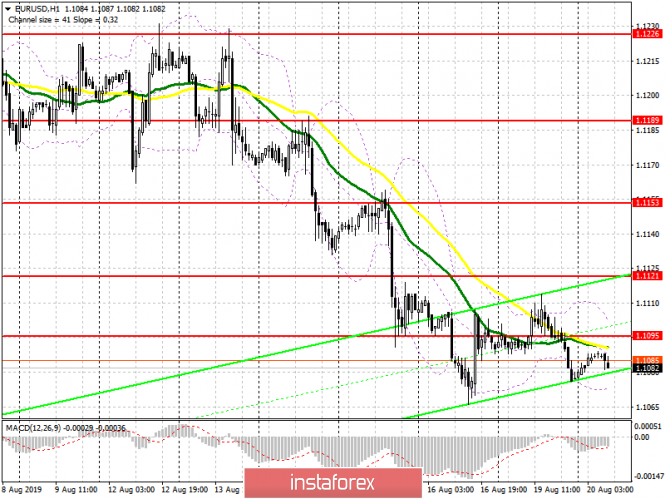
Yesterday, euro buyers managed to keep the pair below the lows of the previous week, which preserves the likelihood of building an upward correction. This will require good data on Germany and producer prices, as well as an exit and consolidation above the resistance of 1.1095, which will increase demand for the euro and lead to the renewal of a larger high of 1.1121, where I recommend taking profits. However, the main target of the bulls will be the 1.1153 level , which will allow us to build a new upward trend in the euro. In case the EUR/USD declines in the morning, it is best to return to long positions to rebound from a low of 1.1059.
To open short positions on EURUSD you need:
Bears need to form a false breakdown in the resistance area of 1.1095, which will only strengthen the downward trend and lead to an update of the low of the last week, which was not done yesterday. However, the farther target of the sellers will be support levels of 1.1028 and 1.0990, where I recommend taking profits. The lack of important news, apart from the report on Germany, could make it possible for EUR/USD to go above the resistance of 1.1095 in the morning. In this scenario, it is best to open short positions on a rebound from the highs of 1.1121 and 1.1153.
Signals of indicators:
Moving averages
Trading is carried out in the region of 30 and 50 moving average, which indicates a slowdown in the downward trend.
Bollinger bands
A break of the lower border of the indicator in the region of 1.1070 will strengthen the bearish trend.
Description of indicators
- MA (moving average) 50 days - yellow
- MA (moving average) 30 days - green
- MACD: Fast EMA 12, Slow EMA 26, SMA 9
- Bollinger Bands 20