
4-hour timeframe
Amplitude of the last 5 days (high-low): 28p - 49p - 101p - 70p - 30p.
Average volatility over the past 5 days: 56p (average).
A completely empty calendar of macroeconomic events makes traders stay out of the market. Those positions that are already open remain open, but new ones do not open, since there are no drivers for this. Thus, volatility fell to the lowest. Yesterday it amounted to only 30 points, so far it was at 24 today. There was not a single one from even minor publications today. Based on this, the emphasis on the forex market is again shifting towards the GBP/USD pair, on which there is clearly more news. Today, it was just like a bolt from the blue that Boris Johnson turned to Queen Elizabeth II of Great Britain with a request to suspend the work of the Parliament for a period of about one month. Naturally, market participants immediately rushed to sell the pound, and everyone forgot about the euro currency.
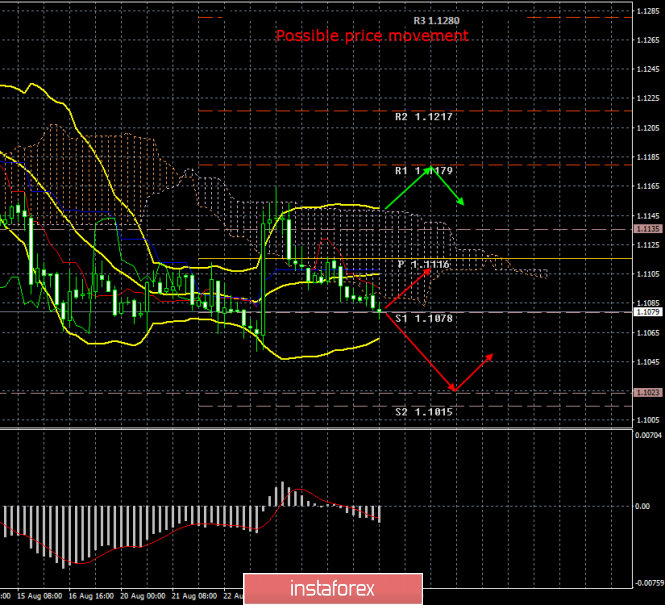
In the current situation, we have only one thing to do. To speculate on the topic, what are the prospects of the European currency paired with the US dollar in the near future? Here we have some interesting factors to predict the future dynamics. The first is a perfect rebound of the pair from the Kijun-sen line on the daily chart using the Ichimoku indicator with standard settings. Every trader can see this rebound, and it is quite a strong sell signal. The second is a rebound from the Senkou span B line on the 4-hour chart, which is seen above. It is also a strong sell signal, as the Senkou span B line itself is strong. The third is a year and a half downward trend for the euro, which is difficult to break a priori. The fourth is the readiness of the ECB to cut rates at the next meetings, to revive the quantitative stimulus program and the lending program for commercial banks. The fifth is the proximity of prices to two-year lows. It usually happens that near lows, traders place either take profit orders in short positions or pending orders against the trend, which leads to sharp price rebounds from areas close to lows. In our case, traders do not expect the euro to strengthen and are going to stop the medium-and long-term sales of the euro/dollar pair. From our point of view, all these factors almost unambiguously speak in favor of the continuation of the downward trend. In favor of its completion, there are much fewer factors, or rather, one - the escalation of the trade conflict between China and the United States may lead in the future to a strong drop in US macroeconomic indicators and to a repeated reduction in the key Fed rate. That is what can lead to a drop in demand for the US currency and its depreciation. However, even this factor is, so to speak, long-term.
On the technical side, the euro/dollar pair has now fallen to the support level of 1.1078. Consolidation below this level will open the way for bears to the level of 1.1023.
Trading recommendations:
EUR/USD continues to move down. At the moment, we can consider sell orders while aiming for the support level of 1.1023, if there are no problems with overcoming the 1.1078 level. Bulls once again showed their weakness, having failed to overcome the Senkou Span B line, so buying the pair is not recommended yet.
In addition to the technical picture, fundamental data and the time of their release should also be considered.
Explanation of the illustration:
Ichimoku indicator:
Tenkan-sen is the red line.
Kijun-sen is the blue line.
Senkou Span A - light brown dotted line.
Senkou Span B - light purple dashed line.
Chikou Span - green line.
Bollinger Bands Indicator:
3 yellow lines.
MACD indicator:
Red line and bar graph with white bars in the indicator window.
The material has been provided by InstaForex Company - www.instaforex.com