
Gold price made a new higher high and a new higher weekly close this week. Trend remains bullish although in the short-term price seems to be moving mostly sideways digesting the big rally from May to June.
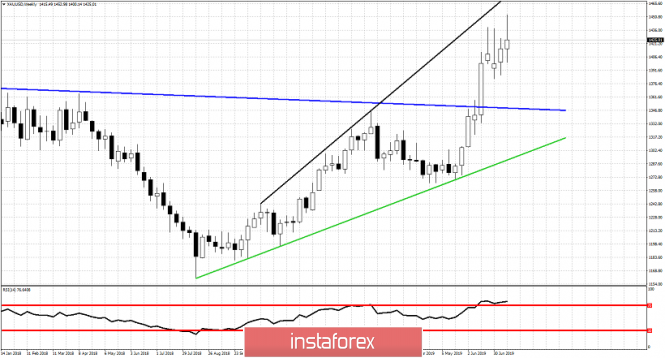
Blue line - long-term resistance trend line (broken)
Green line- long-term support trend line
Black line- resistance
Gold price is in bullish trend since end of July 2018. Price has broken above the major resistance trend line at $1,350 and so far staying above it is a bullish sign for the longer-term trend. Recent weeks Gold price has been trading between $1,450-$,1390 with selling pressures each time price moves towards $1,450. Gold bulls however continue to support the trend as price does not fall below $1,400. As long as price remains above $1,390-$1,400 we remain short- and medium-term optimistic for a move towards $1,500 and higher. Breaking below $1,400-$1,390 will open the way for a back test of the blue broken trend line that is now support and was previously resistance. Long-term bullish trend is in danger only if price breaks below the green trend line.
The material has been provided by InstaForex Company - www.instaforex.com