
Trend analysis.
In the coming week, the price will move down with the first target of 1.1193 – the lower fractal.
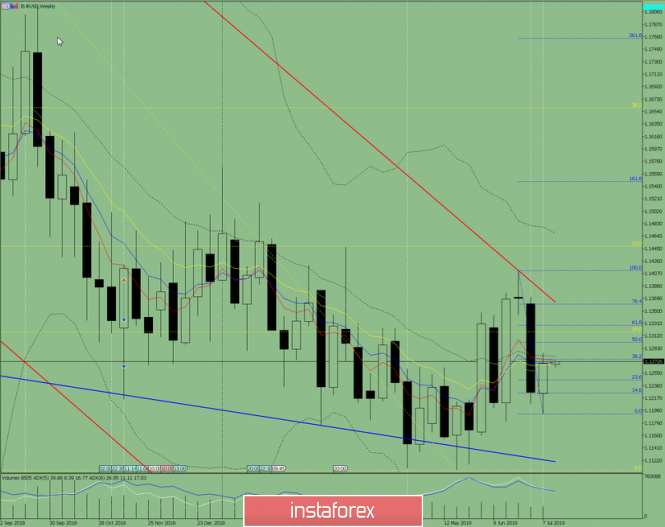
Fig. 1 (weekly chart).
Complex analysis:
- Indicator analysis – down;
- Fibonacci levels – down;
- Volumes – down;
- Candlestick analysis – down;
- Trend analysis – down;
- Bollinger bands – down;
- Monthly schedule – down.
The conclusion from the complex analysis is the downward movement.
The overall result of the calculation of the EUR/ USD currency pair candle on the weekly chart: the price for weeks is likely to have a downward trend with the absence of the first upper shadow of the weekly black candle (Monday – down) and the absence of the second lower shadow (Friday – down).
The material has been provided by InstaForex Company - www.instaforex.com